#Day27 - Topic: future

Global literacy will most likely improve in the foreseeable future.

This is an experimental take on a raincloud plot due to varying "latest assessment" years. Rain drops are of different size and opacity: the further the latest literacy assessment lies back in time, the smaller and fainter the drops are.

#30DayChartChallenge #30DCCNov22Reposts

Tool: #rstats
Data: @ourworldindata
Font: Genos
Code: https://github.com/nucleic-acid/30DayChartChallenge_2022

#raincloudplot #datavis #dataviz #literacy

GitHub - nucleic-acid/30DayChartChallenge_2022: Contributions to the #30DayChartChallenge

Contributions to the #30DayChartChallenge. Contribute to nucleic-acid/30DayChartChallenge_2022 development by creating an account on GitHub.

GitHub

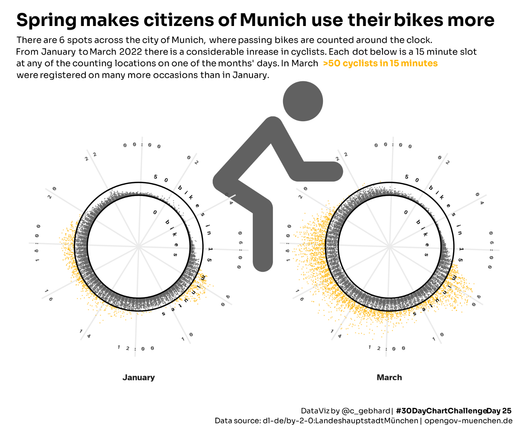
Cyclist counts showed an upward trend in Q1 2022 in Munich (Germany). Considering the seasonal weather improvement, this should be expected.

#30DayChartChallenge #30DCCNov22Reposts #Day25 - Topic: trend

Tool: #rstats
Data: opendata.muenchen.de
Code: https://github.com/nucleic-acid/30DayChartChallenge_2022

#cycling #opendata #datavis #datavis

GitHub - nucleic-acid/30DayChartChallenge_2022: Contributions to the #30DayChartChallenge

Contributions to the #30DayChartChallenge. Contribute to nucleic-acid/30DayChartChallenge_2022 development by creating an account on GitHub.

GitHub

Catching up on the #30DCCNov22Reposts . To keep it short, I'll make a 🧵 of the remaining charts.

This will cover #30DayChartChallenge posts created with #rstats. Other topics: #echarts, #TidyTuesday #gapminder, and data by @ourworldindata #datavis #dataviz

#30DayChartChallenge #30DCCNov22Reposts #Day11 - Topic: circular

Daily precipitation in four north american cities. The cities were chosen at random (this was more of a technical exercise for me).

Tool: #rstats
Data: gridMET by Abatzoglou et. al., 2013, doi: 10.1002/joc.3413 via {climateR} 📦
Color-Scale: MetBrewer
Code: https://github.com/nucleic-acid/30DayChartChallenge_2022

#datavis #climate #rain

GitHub - nucleic-acid/30DayChartChallenge_2022: Contributions to the #30DayChartChallenge

Contributions to the #30DayChartChallenge. Contribute to nucleic-acid/30DayChartChallenge_2022 development by creating an account on GitHub.

GitHub

#30DayChartChallenge #30DCCNov22Reposts #Day13 - Topic: correlations

For this day I updated a plot from a while back: correlations at the 2016 Olympic Games.
Inspired by the iconic Hans Rosling plot.

Tool: #rstats
Data: Gapminder, WorldBank, kaggle user rgriffin
Code: https://jollydata.blog/posts/2021-01-01-olympic-history/#bringing-it-all-together

#datavis #dataviz #olympics2016 #olympics #sports #gapminder #WorldBank

Redirect

Distance of exoplanets to their host star(s). This plot is experimental & oversimplifies. The struggle was the highly skewed distance distribution, so a log scale was necessary, which conflicts with the assumed center/zero of the circle.

Feedback and critique is very welcome!
If I offended anyone on #astrodon, I apologize in advance.

#30DCCNov22Reposts
Tool: #rstats
Data: NASA Exoplanet Archive, doi: 10.26133/NEA12
Color-Scale: Viridis/E
Fonts: Jura, Audiowide

#datavis #30DayChartChallenge

Trying to catch up with #30DCCNov22Reposts #day7

Topic: physical

Physical bird measurements: wing lengths of almost 10k bird species.
Data: AVONET database doi:10.6084/m9.figshare.16586228.v5

Tool: #rstats @rstats
Color-Scale: MetBrewer
Fonts: Playfair Display, Lato
Code: https://github.com/nucleic-acid/30DayChartChallenge_2022

#30DayChartChallenge #datavis #dataviz #birds

GitHub - nucleic-acid/30DayChartChallenge_2022: Contributions to the #30DayChartChallenge

Contributions to the #30DayChartChallenge. Contribute to nucleic-acid/30DayChartChallenge_2022 development by creating an account on GitHub.

GitHub
30DCC (2022) - 6  OWiD

Code and charts for the 2022 30-Day Chart Challenge

30DCC (2022) - 5  Slope

Code and charts for the 2022 30-Day Chart Challenge

30DCC (2022) - 4  Flora

Code and charts for the 2022 30-Day Chart Challenge