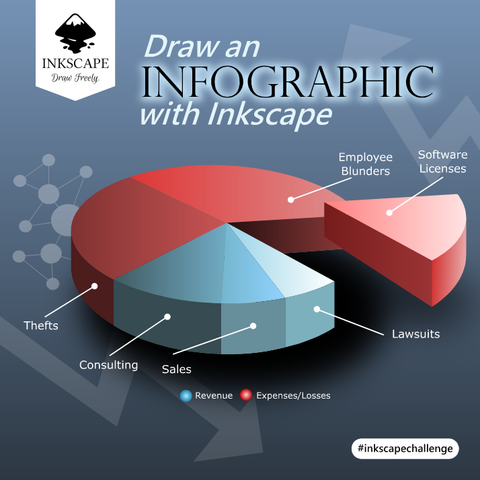
The June #Inkscape challenge is to
Draw an Infographic 📊
Grab a set of stats and create a juiced up infographic to illustrate those numbers. Bar Graph 🍫 , Line Graph 🪱 Pie Chart 🥧 ; any type of graphic that illustrates data set values. Say goodbye to dreary reports with bland off-the-shelf charts.
Come join us on the June Challenge page:
https://inkscape.org/forums/competitions/inkscape-challenge-june-2026/


 🏳️🌈🖖🏽
🏳️🌈🖖🏽