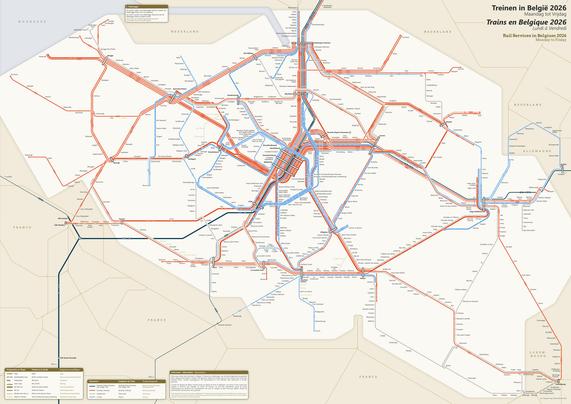
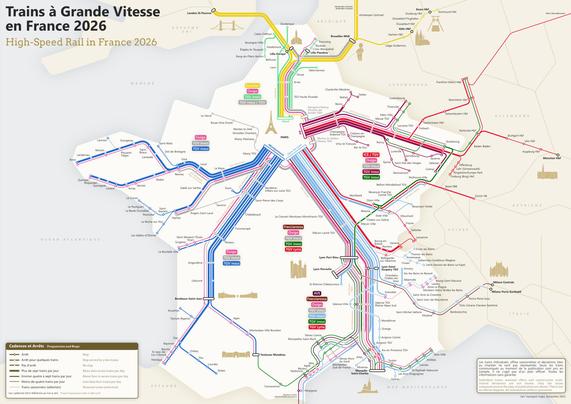
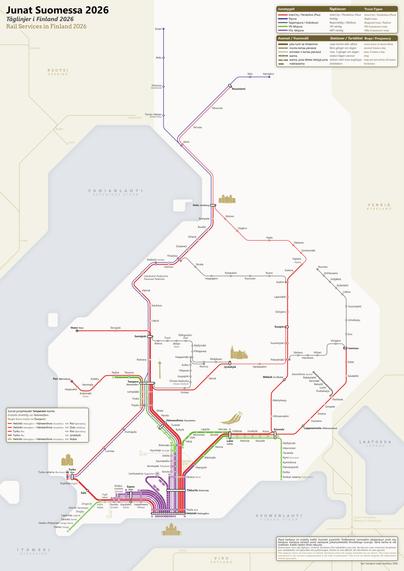
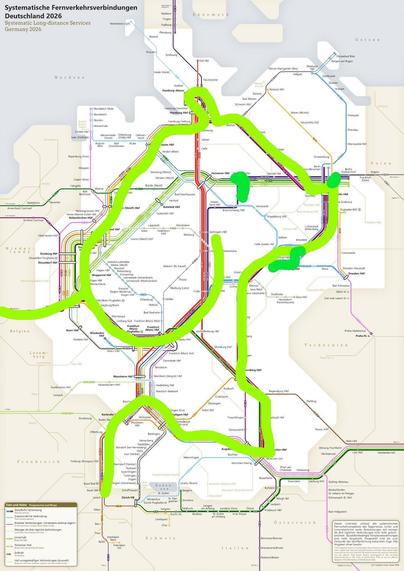
By now, all eleven of my country 🚂 #train diagrams have been updated for 2026! Represented are: 🇦🇹🇧🇪🇩🇰🇫🇮🇫🇷🇩🇪🇱🇺🇳🇱🇳🇴🇸🇪🇨🇭 I really enjoy updating the diagrams; however, I'm also glad when I've finished. I have become quicker, but it still takes a lot of effort. I hope they help you plan your spring, summer or autumn holiday tour through central or northern 🇪🇺 #Europe or whatever you need them for. 😊
👉️ You find the 2026 rail diagrams on my website: https://larstransportmaps.com/

@larstransportworld nice — thank you for these beautiful diagrams 😃

Do you by any chance plan on doing Europe-wide diagrams as well, for planning Interrail adventures and the like?

@janeckhoff Europe-wide diagrams would be very nice, indeed! So far, two reasons have prevented me from creating a Europe-wide map: on the one hand, I would have to limit oneself to long-distance services, for which there is no standard definition. On the other hand, the timetables have become more dynamic, meaning that adjustments are now made also throughout the year. This makes it difficult to update the entire network before the next changes come along. We'll see...
@larstransportworld thanks! Now I realized that I could go Vienna-Zurich-Lyon-Barcelona, instead of heading to Paris...
@larstransportworld
This is gorgeous, thanks for that!

@larstransportworld What have you learned over time making all these diagrams?

Also since you update, have you noticed any trend? How is the European network expansion going according to your observations? :)

@madeindex Hmm... That’s a very interesting, but also difficult question. Most of it is probably learned intuitively rather than consciously. What springs to mind straight away is:
- As a transport planner, I tend to want to simplify things in diagrams to make them as clear as possible and to illustrate the ‘system’. However, many users expect every exception or individual case to be shown somewhere. I try to respond to this by explaining the simplifications more clearly in the text.
(1/6)
@madeindex - The process of simplifying or abstracting the timetable, i.e. sensibly grouping connections into a single graphical line, takes a great part of effort.
- Generally speaking, I think the presentation has improved over time: I’ve even taken my first few diagrams offline. With completely new diagrams, I try to find a structure that suits the country. I’m thinking of France, definitely the diagram with the best ‘structure’.
(2/6)
@madeindex - I do my utmost to create accurate diagrams. It doesn’t always work 100%. But I can count on feedback that points this out to me straight away. 😊 (3/6)
@madeindex The way the service offering has changed varies from country to country. In my view, the general trends since around 2020 are as follows:
- There is once again a greater focus on (rather unsystematic) individual international connections that also cover longer distances (e.g. Berlin–Paris, Zurich–Florence, Oslo–Malmö).
- Competition from state-owned railways is intensifying, particularly in countries such as Sweden and France, but also in other countries like Germany or Austria.
(4/6)
@madeindex - The arrival of additional operators is also leading to a gradual blurring of ‘train categories’ with these being increasingly adapted to national requirements (e.g. EuroCityExpress in Germany).
- Regional services are increasingly being upgraded to long-distance services (e.g. Interregio in Austria), whilst ‘genuine’ long-distance services are tending to concentrate on the main routes. National long-distance services to less populated regions are rather on the decline.
(5/6)
@madeindex - Night trains are very dynamic. For the Germany night diagram, I have to make significant adjustments to the timetable every year.
And there are certainly other factors that don’t spring to mind right now.
(6/6)

@larstransportworld Thank you for all the insight & detailed reply, also thank you for putting so much effort into your cards, they are beautiful :)

If you had to say, in which countries in Europe (of the ones you are watching closely) is the network/coverage improving and in which getting worse?

@larstransportworld Is that only the case for national long-distance? I heard that in some regions in Europe the smaller lines are being completely closed, due to urbanization, cost cutting etc.?

Also that in France the network connections between the big cities towards Paris are great, but the coverage in the rest of the country isn't very good?

@larstransportworld having the maps in the same style helps so much!

Having one that’s interactive (click a route to focus or plan a multi country route) would be really helpful

Is it open source?
@lil5 Thank you for your feedback! Yes, creating an interactive plan would be a nice idea. Unfortunately, I’m not as interested in the technical side of things as I am in creating the diagrams themselves, so this is unlikely to happen. 😐
The diagrams are provided under CC BY-NC-ND 4.0 license.
@larstransportworld unless the line got dropped without me knowing it, but i don't see the bordeaux-strasbourg line (which is high-speed) '-'
@larstransportworld wow, makes me realise just how hyper-centralised France is!? Especially compared to places like Germany. *Everything* routes to Paris!
@larstransportworld would u be interested in doing italy next ? ^^
@larstransportworld
Can't unsee the doggo!
#doggo #cantunsee
@MrGamy @larstransportworld
That is nice, as I always see the S-Bahn-Ring of Berlin like a dog's head. And it is looking back 🦮
@larstransportworld Wait, the diagram for France only shows the TGVs!

@larstransportworld I love your enthusiasm.
you sound like a modern Harry Beck 😁

https://en.wikipedia.org/wiki/Harry_Beck

Harry Beck - Wikipedia

@Eurospoofer What an honour to be compared to Harry Beck 😁
Peatused | Elron

@plaes Unfortunately, no Estonia at the moment 😐 But I've spent a couple of days in Estonia last year for the first time, so I have thought about it once.

@larstransportworld

It would be nice to see Spain (as sparse as its conventional rail network can currently be)

@larstransportworld these are still cool! But I feel like the German one is currently more of a theory with all the construction and rerouting going on everywhere in the network 😅 (I'm longing for the time when it to go back to the state that you're showing and I can have my theoretical direct ICE line to Switzerland back :3)

@larstransportworld  Thank you!

Looking at Austria, I'm reminded of why I love living close to Wien Meidling. 💚

@larstransportworld boosting is my way of saying thank you.
Poland? Czech?
@larstransportworld waiting for Poland 🇵🇱

@larstransportworld
Excellent, as always!

Nit-pick on the Sweden map: the Uppsala-Stockholm SJ regional was cancelled in december 2024, and Mälartåg took over that service (SJ did it non-subsidized, SL & Mälartåg did it since a few years subsidized).

@Gurre Tack! I will correct that. I still miss the Resrobot timetables, it was a lot easier with SJ Regional and Mälartåg.

@larstransportworld

Hey, Lars, awesome!
special thanks for #EuropeanSleeper

My feature request :) would be to publish the underlying data as json / geojson or directly ActivityPub JSON.
I am currently doing the same for all the European Roads, BAB and AT /CH Autobahn [later the rest].
It is for fedigeo (based on geohash and ActivityPub) from OSM, wikidata/wikibase and multiple sources like the @Lilith Autobahn API ;) ...

My goal for fediway (part of fedigeo, [`Collection` `Travel`]) is that the user
- finds someting like the diagram in `image` and `url` (website)
but also
- can use the "reduced" geometry with any client map
- has a strictly `OrderedCollection` of the practical waypoints and waylinks which could show thedata and list in the infobox of e.g. https://de.wikipedia.org/wiki/Bundesautobahn_1
[ incl. electric charging etc. like in https://github.com/bundesAPI/autobahn-api/blob/main/README.md ]

/ @jaywink
@benpate
@clemensg

Bundesautobahn 1 – Wikipedia

@larstransportworld never seen a clearer depiction of how BE>>FR