#GermanEnergyFact #4 ctd.

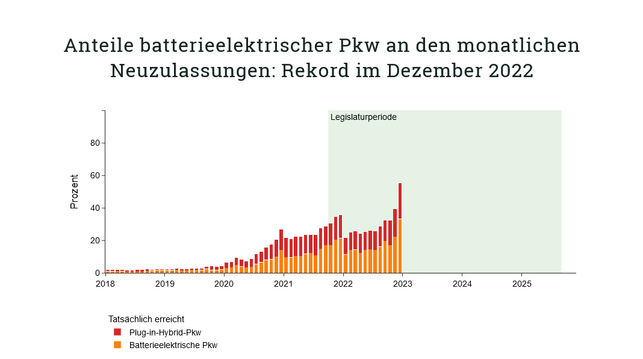
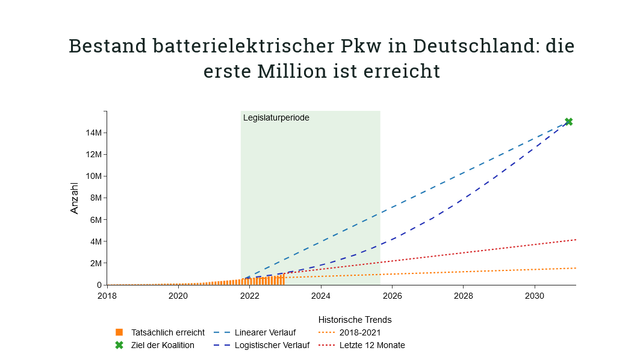
Für alle, die es lieber auf Deutsch lesen: zoombare Abbildungen zum Dezember-Rekord bei der #Elektromobilität sowie zur erreichten ersten Million bei der Bestandsflotte batterieelektrischer #Pkw gibt es jetzt auch als kleinen Blog #5 im #DIW #Ampelmonitor #Energiewende: https://www.diw.de/de/diw_01.c.862674.de/nachrichten/ampel-monitor_energiewende__5__eine_million_elektrofahrzeuge__zulassungsrekord_im_dezember.html
#Elektroauto #KBA

DIW Berlin: Ampel-Monitor Energiewende #5: Eine Million Elektrofahrzeuge, Zulassungsrekord im Dezember

Von Wolf-Peter Schill Die Abbildung zeigt die Anteile von rein batterieelektrischen Pkw (sowie ergänzend auch von Plug-in-Hybriden) an den monatlichen Neuzulassungen laut Kraftfahrt-Bundesamt. Im Dezember 2022 hatten batterieelektrische Pkw einen Anteil von 33,2 Prozent an den Pkw-Neuzulassungen in Deutschland, das ist bisheriger Rekord. Hinzu kamen 22,2 Prozent Plug-in Hybride. Somit hatten im Dezember ...

DIW Berlin

#GermanEnergyFact #5: It gets dirty - lets talk about coal.

After two unplanned digressions (LNG and electric cars), I now return to primary #energy consumption facts for 🇩🇪 , this time focusing on hard #coal. I use new #AGEB data available here: https://ag-energiebilanzen.de/wp-content/uploads/2022/11/03-Steinkohle_2022.pdf

▶️ Overall coal consumption increased by nearly 5% in 2022 vs. 2021. #wrongdirection
▶️ Overall consumption in 2022 was 323 TWh, or nearly 4000 kWh per capita. #thisisstillalot

#GermanEnergyFact #5 ctd.

▶️ The increase in hard #coal consumption in 2022 was particularly high for coal used in power plants (+16%), driven by a surge in #electricity prices and increased electricity exports.
▶️ In contrast, coal used for steel making decreased (-6%). This goes hand in hand with a decrease in steel production of roughly the same size (compare German steel industry press release https://www.stahl-online.de/medieninformationen/rohstahlproduktion-in-deutschland-november-2022/)

Rohstahlproduktion in Deutschland: November 2022 | stahl-online.de

Die Rohstahlerzeugung in Deutschland ist im November 2022 im Vergleich zum Vorjahr um 18 Prozent auf rund 2,8 Millionen Tonnen eingebrochen. Das ist der niedrigste Wert seit Juli 2020. Im aufgelaufenen Zeitraum von Januar bis November beträgt der Rückgang der Rohstahlproduktion nunmehr rund 8 Prozent. Aller Voraussicht nach wird die Erzeugung im Jahr 2022, wie […]

stahl-online.de |

#GermanEnergyFact #6 is even more dirty than the last one: #lignite

Here is most recent #AGEB data on lignite for 2022: https://ag-energiebilanzen.de/wp-content/uploads/2022/12/BK-KJ22-erste-Schatzung-09.12.2022.pdf

▶️ Primary #energy consumption of lignite in 🇩🇪 increased by 5% in 2022 vs. 2021. #wrongtrend
▶️ The overall consumption in 2022 was 329 TWh. That is nearly 4000 kWh per capita #thatsalot!
▶️ Around 90% of this was used for #electricity generation, which was also up by around 5% vs. 2021, driven by exploding electricity prices

#GermanEnergyFact #6 ctd.

▶️ Using these numbers, you can calculate an average efficiency of #electricity generation from #lignite of slightly below 40% in 2022.
▶️ That is, around 178 TWh of primary energy from lignite went through the chimneys and cooling towers of power plants unused - around 2100 kWh per capita 🤯

#endcoal #leaveitintheground Photo: @mariusmichusch

#GermanEnergyFact #7: natural #gas

Yesterday, the Bundesnetzagentur released new data on 🇩🇪 natural gas consumption in 2022: https://www.bundesnetzagentur.de/DE/Gasversorgung/aktuelle_gasversorgung/Rueckblick/start.html

▶️ Overall gas consumption in 2022 was 847 TWh, 17.6% less than 2021
▶️ Households and commerce reduced consumption by 19.1% (wow!), industry by 16.6% compared to 2021
▶️ Savings were driven by much-increased gas prices, warmer weather, and changes in heating behavior
▶️ Some data discrepancies between BNetzA and AGEB data, but savings trend is similar

Bundesnetzagentur - Rückblick: Gasversorgung im Jahr 2022

Rückblick: Gasversorgung im Jahr 2022

#GermanEnergyFact #7 ctd.

Zooming in on #gas savings made by households and commercial consumers: in the #openenergytracker, we regularly differentiate savings components related to temperature and to changes in behavior: https://openenergytracker.org/en/docs/germany/naturalgas/

We find that households and commerce have consistently saved gas by changing their behavior since September 2022. Except for the Christmas week it seems - maybe people wanted to have it as cosy as usual during these days? 🎄 Great work by @aroth 👏

Current natural gas consumption - Open Energy Tracker

The Open Energy Tracker is a platform to track governmental goals of energy policies.

#GermanEnergyFact #8: oil

I'm wrapping up this first week with some #oil consumption data for 🇩🇪 (sorry I'm a bit late, this was a family day), based on recent #AGEB data: https://ag-energiebilanzen.de/wp-content/uploads/2022/12/01-Mineraloel_2022.pdf

▶️ Sales of #diesel fuel decreased by 1% from 2021 to 2022, #gasoline +4%, jet fuel +44% (!)
▶️ Mio t are hard to deal with, so here are derived liter/capita numbers: ~490 l diesel, ~270 l gasoline, ~130 l jet fuel per person. Note: these averages includes all people, also those who never drive or fly.

#GermanEnergyFact #8 ctd.

So I'm clearly not an expert when it comes to supply and demand of oil products; but I found it quite interesting that the sales of diesel fuel hardly decreased despite much higher prices, and gasoline sales even slightly increased.

The post-pandemic surge in jet fuel use is also striking (and worrying).

Thanks for following me through this first week, which largely focused on indicators of #energy consumption. Next week may see a focus on energy #prices, stay tuned!

#GermanEnergyFact #9: wholesale electricity prices ⚡ 💶

Data provided by the Bundesnetzagentur / SMARD platform shows that 2022 was a record-breaking year in terms of #electricity #prices: https://www.smard.de/home/downloadcenter/download-marktdaten/?downloadAttributes=%7B%22selectedCategory%22:3,%22selectedSubCategory%22:8,%22selectedRegion%22:%22DE-LU%22,%22selectedFileType%22:%22XLSX%22,%22from%22:1609455600000,%22to%22:1672527599999%7D

▶️ The average day-ahead wholesale price in 🇩🇪 more than doubled from around 97 €/MWh in 2021 to 235 €/MWh in 2022
▶️ The highest hourly price increased from 620 to 871 €/MWh
▶️ The price spread also increased a lot: the interquartile range increased from 59 to 176 €/MWh

#energymastodon

SMARD | Marktdaten

#GermanEnergyFact #9 ctd.

▶️ The wholesale price increase was driven by a surge in natural #gas prices.
▶️ Further, low generation from hydro power and French nuclear contributed to high prices.
▶️ Generators with low marginal costs have benefited a lot from this - which lead to a EU-wide temporary revenue cap for generators.
▶️ Any technology that could offer temporal #flexibility must have made tons of money in 2022. Probably a golden year for electricity #storage and other flex technologies!

#GermanEnergyFact #10: natural gas import prices

A main reason for the surge in wholesale electricity prices (see #GermanEnergyFact #9) is a record increase in natural #gas #import #prices, as gas-fired plants often set hourly electricity prices. Data provided by the Federal Statistical Office of 🇩🇪 : https://www.destatis.de/DE/Themen/Wirtschaft/Preise/Publikationen/Energiepreise/energiepreisentwicklung-xlsx-5619001.xlsx

▶️ Gas import prices in 2022 on average increased by factor 3 compared to 2021, and nearly by factor 7 (!) vs. 2020 (only counting Jan-Nov)
▶️ The peak month was August 2022

Daten zur Energiepreisentwicklung - Lange Reihen bis November 2022

Diese monatlich herausgegebene Veröffentlichung fasst Daten zur Entwicklung der Energiepreise aus unterschiedlichen Statistiken der Gruppe Preise sowie von Eurostat zusammen. Für einzelne Energiearten (Steinkohle, Braunkohle, Erdöl, Erdgas, Benzin, Diesel, leichtes Heizöl, Flüssiggas, Strom, Fernwärme) werden in einem Textteil zunächst kurze Erläuterungen, insbesondere zu Aufkommen und Verwendung sowie zu Preisbildungsmechanismen gegeben.

Statistisches Bundesamt

#GermanEnergyFact #11: hard #coal import prices

Not only 🇩🇪 gas import prices increased a lot in 2022, but also hard coal prices. Again, data provided by the Federal Statistical Office: https://www.destatis.de/DE/Themen/Wirtschaft/Preise/Publikationen/Energiepreise/energiepreisentwicklung-xlsx-5619001.xlsx

▶️ Hard coal import prices in 2022 on average increased nearly by a factor 3 vs. 2021, and by a bit less than factor 5 vs. 2020 (only counting Jan-Nov for consistency)
▶️ This also contributed to increasing electricity prices

(sorry, no graph today, just numbers, as I don't have much time)

Daten zur Energiepreisentwicklung - Lange Reihen bis November 2022

Diese monatlich herausgegebene Veröffentlichung fasst Daten zur Entwicklung der Energiepreise aus unterschiedlichen Statistiken der Gruppe Preise sowie von Eurostat zusammen. Für einzelne Energiearten (Steinkohle, Braunkohle, Erdöl, Erdgas, Benzin, Diesel, leichtes Heizöl, Flüssiggas, Strom, Fernwärme) werden in einem Textteil zunächst kurze Erläuterungen, insbesondere zu Aufkommen und Verwendung sowie zu Preisbildungsmechanismen gegeben.

Statistisches Bundesamt

#GermanEnergyFact #12: household electricity prices

If you are following this thread, you may recall that German wholesale #electricity #prices increased a lot in 2022, largely driven by high natural gas (and also hard coal) prices. This also led to higher household electricity prices. The 🇩🇪 energy industry association #BDEW regularly publishes household electricity price data for a typical household in Germany, with fixed price components also allocated to consumption: https://www.bdew.de/service/daten-und-grafiken/bdew-strompreisanalyse/

BDEW-Strompreisanalyse Oktober 2025

Haushalte und Industrie, Steuern und Beschaffung: So hat sich der Strompreis in Deutschland entwickelt. ►Zur Analyse 2025

#GermanEnergyFact #12 ctd.

So, a few key facts:
▶️ Between 2021 and the second half of 2022, household #electricity #prices increased from around 32 ct/kWh to 40 ct/kWh.
▶️ The relative increase was much lower than the increase in wholesale prices for two reasons:
i) retailers procure electricity up to around 3 years in advance on future markets, so current wholesale price increases are not fully visible yet;
ii) household prices include various other price components, dampening the effects.

#GermanEnergyFact #12 ctd.

▶️ More generally speaking, 🇩🇪 household #electricity #prices include costs for distribution and metering, regulated network charges, and various taxes, levies and surcharges.
▶️ In the years 2013 to 2021, these taxes, levies and surcharges accounted for more than half (!) of the household electricity price.
▶️ In the wake of the current crisis, procurement costs have risen sharply due to high wholesale prices, so the share of taxes/duties/levies fell to under one-third.

#GermanEnergyFact #12 ctd.

▶️ The #EEG levy, which has been charged since 2000 to finance the expansion of renewable energy sources, was abolished on July 1, 2022.
▶️ However, this relief was more than offset by the increase in procurement costs in 2022.
▶️ You can expect that prices continue to increase in 2023, probably to (or above) 50 ct/kWh.

Click- and zoomable graphs and underlying data (also an inflation-adjusted version) in 🇬🇧 , 🇩🇪 and 🇫🇷 in the #openenergytracker: https://openenergytracker.org/en/docs/germany/prices/

Energy prices - Open Energy Tracker

The Open Energy Tracker is a platform to track governmental goals of energy policies.

#GermanEnergyFact #13: gasoline and diesel prices

Not only the prices of gas, coal, and electricity increased a lot in 🇩🇪 in 2022, but also consumer prices for #gasoline and #diesel. Again, drawing on recent data provided by the Federal Statistical Office of Germany #destatis: https://www.destatis.de/DE/Themen/Wirtschaft/Preise/Publikationen/Energiepreise/energiepreisentwicklung-xlsx-5619001.xlsx:

▶️ Average gasoline prices in Germany in 2022 were 23% higher than in 2021, and 50% above 2020 levels.
▶️ Diesel prices on average increased by 40% vs. 2021 and by 74% vs. 2020.

#energymastodon

Daten zur Energiepreisentwicklung - Lange Reihen bis November 2022

Diese monatlich herausgegebene Veröffentlichung fasst Daten zur Entwicklung der Energiepreise aus unterschiedlichen Statistiken der Gruppe Preise sowie von Eurostat zusammen. Für einzelne Energiearten (Steinkohle, Braunkohle, Erdöl, Erdgas, Benzin, Diesel, leichtes Heizöl, Flüssiggas, Strom, Fernwärme) werden in einem Textteil zunächst kurze Erläuterungen, insbesondere zu Aufkommen und Verwendung sowie zu Preisbildungsmechanismen gegeben.

Statistisches Bundesamt

#GermanEnergyFact #14: import prices of #oil, #gas and #coal

I conclude my second week of German #energy facts with another price graph, drawing on recent #destatis data: https://www.destatis.de/DE/Themen/Wirtschaft/Preise/Publikationen/Energiepreise/energiepreisentwicklung-xlsx-5619001.xlsx

▶️ Striking how import prices of gas and coal increased (and recently decreased) largely in parallel in the wake of Russia's attack on Ukraine.
▶️ Oil prices also increased, but much less.
▶️ Note: coal & gas are substitutes in electricity generation to some extent, but oil is hardly used for this in 🇩🇪 .

Daten zur Energiepreisentwicklung - Lange Reihen bis November 2022

Diese monatlich herausgegebene Veröffentlichung fasst Daten zur Entwicklung der Energiepreise aus unterschiedlichen Statistiken der Gruppe Preise sowie von Eurostat zusammen. Für einzelne Energiearten (Steinkohle, Braunkohle, Erdöl, Erdgas, Benzin, Diesel, leichtes Heizöl, Flüssiggas, Strom, Fernwärme) werden in einem Textteil zunächst kurze Erläuterungen, insbesondere zu Aufkommen und Verwendung sowie zu Preisbildungsmechanismen gegeben.

Statistisches Bundesamt

#GermanEnergyFact #14 ctd.

Thanks for following me here until now. If you like, please share your feedback: do you find these German #energy facts useful/interesting/boring? For me, it's actually quite a bit of fun, I force myself to look at some statistics which I might otherwise ignore.

Next week, I might focus on renewable energy. Stay tuned, and enjoy the weekend!

#GermanEnergyFact #15: share of #renewables in the #electricity sector

New data for 2022 provided by @BMWK: https://www.bmwk.de/Redaktion/DE/Downloads/Energie/230102-erneuerbare-energien-ueberblick-zubauzahlen-und-beschleunigungsmassnahmen.pdf?__blob=publicationFile&v=4. Click- and zoomable graph in the #openenergytracker: https://openenergytracker.org/en/docs/germany/electricity/#shares-in-the-power-sector

▶️ The 🇩🇪 government aims for a share of 80% renewable generation in gross electricity consumption by 2030.
▶️ In 2022, this share increased to ~47% according to #BMWK, driven by a better #wind and #solar year, and some expansion of #renewable capacities (particularly solar).

#Energiewende

#GermanEnergyFact #15 ctd.

▶️ In 2020, the share of #renewable generation in gross #electricity consumption already was as high 45.3%, caused by lower electricity demand during the pandemic.
▶️ In 2021, the share decreased to 41.0% because of higher electricity consumption in the wake of the economic recovery, and a relatively poor wind year.
▶️ To reach the 2030 target, the share must grow by more than 4 %-points per year on average from 2021 onwards.

#rampitup #energytransition

#GermanEnergyFact #16: installed capacity of #solar #PV in 🇩🇪

I promised this week would focus on #renewables, so let's continue with solar #photovoltaics capacity, using data published today by #AGEE-Stat / #Umweltbundesamt: https://www.umweltbundesamt.de/themen/klima-energie/erneuerbare-energien/erneuerbare-energien-in-zahlen/monats-quartalsdaten-der-agee-stat. Graphs from the #openenergytracker: https://openenergytracker.org/en/docs/germany/electricity/#solar-pv

▶️ By the end of Nov 22, PV capacity was 66.1 GW.
▶️ The 🇩🇪 government aims for 215 GW by 2030.
▶️ Currently we are on track, but the expansion speed has to increase to meet the 2030 target.

Monats- und Quartalsdaten der AGEE-Stat

Zeitnahe Informationen zur Entwicklung der erneuerbaren Energien im Jahresverlauf sind ein wichtiger Indikator für den Fortschritt der Energiewende. Ergänzend zu den Zeitreihen auf Jahresbasis veröffentlicht die Arbeitsgruppe Erneuerbare Energien-Statistik (AGEE-Stat) deshalb an dieser Stelle Monats- und Quartalsdaten für das laufende Jahr.

Umweltbundesamt

#GermanEnergyFact #16 ctd.

▶️ In Nov 22, this corresponded to 0.78 kW of installed solar #PV capacity per capita.
▶️ The 2030 target of 215 GW relates to a value of 2.6 kW/capita, assuming a constant population.
▶️ The 2040 target of 400 GW (!) implies 4.7 kW/capita. That's quite a lot 💪

#energymastodon crowd: What are the values for you country🌎?

Disclaimer: newer data than Nov 2022 is available from the #BNetzA #Marktstammdatenregister, but not reliable yet because of time lags in reporting.

#GermanEnergyFact #17: installed capacity of #onshore #wind power in 🇩🇪

Let's continue with onshore wind capacity, again using data by #AGEE-Stat / #Umweltbundesamt: https://www.umweltbundesamt.de/themen/klima-energie/erneuerbare-energien/erneuerbare-energien-in-zahlen/monats-quartalsdaten-der-agee-stat. Graphs from the #openenergytracker: https://openenergytracker.org/en/docs/germany/electricity/#wind-energy

▶️ By the end of Nov 22, the installed onshore wind capacity was 57.9 GW.
▶️ The 🇩🇪 government aims for 115 GW by 2030.
▶️ Currently we are below the required expansion path, and the speed has to increase a lot to meet the 2030 target.

#Energiewende

Monats- und Quartalsdaten der AGEE-Stat

Zeitnahe Informationen zur Entwicklung der erneuerbaren Energien im Jahresverlauf sind ein wichtiger Indikator für den Fortschritt der Energiewende. Ergänzend zu den Zeitreihen auf Jahresbasis veröffentlicht die Arbeitsgruppe Erneuerbare Energien-Statistik (AGEE-Stat) deshalb an dieser Stelle Monats- und Quartalsdaten für das laufende Jahr.

Umweltbundesamt

#GermanEnergyFact #18: installed capacity of #offshore #wind power in 🇩🇪

Now, offshore wind, again using data by #AGEE-Stat / #Umweltbundesamt: https://www.umweltbundesamt.de/themen/klima-energie/erneuerbare-energien/erneuerbare-energien-in-zahlen/monats-quartalsdaten-der-agee-stat. Graphs from the #openenergytracker: https://openenergytracker.org/en/docs/germany/electricity/#offshore

▶️ By the end of Nov 22, the installed offshore wind power capacity was 8.1 GW.
▶️ There has been hardly any development for years.
▶️ But now 🇩🇪 really plans to get started with a 30 GW target for 2030.
▶️ In 2023 alone, there will be tenders for an additional 8.8 (!) GW.

Monats- und Quartalsdaten der AGEE-Stat

Zeitnahe Informationen zur Entwicklung der erneuerbaren Energien im Jahresverlauf sind ein wichtiger Indikator für den Fortschritt der Energiewende. Ergänzend zu den Zeitreihen auf Jahresbasis veröffentlicht die Arbeitsgruppe Erneuerbare Energien-Statistik (AGEE-Stat) deshalb an dieser Stelle Monats- und Quartalsdaten für das laufende Jahr.

Umweltbundesamt

#GermanEnergyFact 18 ctd.

That is, Germany will auction more #offshore #wind capacity in 2023 than we currently have. Some kind of #Zeitenwende, if you ask me.

Fun fact: the last auction in September 2022, 980 MW, had a winning bid of exactly 0 ct/kWh: https://www.bundesnetzagentur.de/DE/Beschlusskammern/1_GZ/BK6-GZ/2022/BK6-22-011/Fläche%20N7.2_Bekanntmachung/Bekanntgabeseite.html;jsessionid=7B77119881F4C316887AF897182B1869?nn=709672.

#renewables #Energiewende

Bundesnetzagentur - Ausschreibungen - BK6-22-011

#GermanEnergyFact #19: heat pumps

▶️ In 2022, 236,000 new #heatpumps were installed in 🇩🇪 - a new record! Source: https://www.waermepumpe.de/presse/pressemitteilungen/details/waermepumpenabsatz-2022-wachstum-von-53-prozent-gegenueber-dem-vorjahr/#content
▶️ The stock of heat pumps increased to nearly 1.7 million (note: this also includes some heat pumps that only provide domestic hot water).
▶️ The 🇩🇪 government aims for a yearly addition of 500,000 heat pumps from 2024 on, and a stock of at least 6 mio by 2030.

Additional info, zoomable graph and underlying data on the #openenergytracker: https://openenergytracker.org/en/docs/germany/heat/#heat-pumps

Wärmepumpenabsatz 2022: Wachstum von 53 Prozent gegenüber dem Vorjahr

Berlin, 16.01.2023. Der Absatz von Heizungswärmepumpen stieg im Jahr 2022 laut der gemeinsamen Absatzstatistik von BWP und BDH auf 236.000 Geräte und damit um 53 Prozent gegenüber dem Vorjahr. Zur weiteren Beschleunigung des Wärmepumpenausbaus fordert der Bundesverband Wärmepumpe eine rasche und konsequente Umsetzung der angekündigten Novelle des Gebäudeenergiegesetzes sowie weitere Maßnahmen zur Entlastung des Strompreises. Auch mit industriepolitischen Instrumenten solle der Markthochlauf unterstützt werden. 

#GermanEnergyFact #20: #renewable #electricity generation

Earlier this week, I talked about renewable generation capacity (GW) in 🇩🇪 (facts #16-18). #AGEE-Stat also provides up-to-date data on renewable electricity generation (TWh): https://www.umweltbundesamt.de/themen/klima-energie/erneuerbare-energien/erneuerbare-energien-in-zahlen/monats-quartalsdaten-der-agee-stat#Quartalsdaten (sorry for the German chart, no time for translation today)

▶️ Overall renewable electricity generation in 2022 was a bit above 250 TWh, the highest value ever. The trend is good - but we need much more to make the #Energiewende really happen

Monats- und Quartalsdaten der AGEE-Stat

Zeitnahe Informationen zur Entwicklung der erneuerbaren Energien im Jahresverlauf sind ein wichtiger Indikator für den Fortschritt der Energiewende. Ergänzend zu den Zeitreihen auf Jahresbasis veröffentlicht die Arbeitsgruppe Erneuerbare Energien-Statistik (AGEE-Stat) deshalb an dieser Stelle Monats- und Quartalsdaten für das laufende Jahr.

Umweltbundesamt

#GermanEnergyFact #20 ctd.

▶️ #Renewable #electricity generation in 🇩🇪 was 8% higher in 2022 compared to 2021.
▶️ Main reasons: it was much windier 💨 , and there were more sunshine hours ☀️ . In addition, #PV capacities also increased (see #GermanEnergyFact #16).
▶️ The share of variable renewables (wind & PV) in overall renewable generation was 77% (!).
▶️ You can expect this share to increase further in the future, as all the growth in renewable electricity will come from #wind and #PV.

#GermanEnergyFact #21: complementary monthly generation of #wind and #solar #PV

Today, no hard numbers, just visuals: monthly generation from PV (yellow) in 🇩🇪 is relatively high between around April and September, while generation from wind power (dark & light blue) is above-average between around October and March. Nice seasonal balancing (on a monthly basis).

Source: #AGEE-Stat https://www.umweltbundesamt.de/themen/klima-energie/erneuerbare-energien/erneuerbare-energien-in-zahlen/monats-quartalsdaten-der-agee-stat#Quartalsdaten

(sorry, again a German graph - but I'm sure you get the point without reading the legend)

Monats- und Quartalsdaten der AGEE-Stat

Zeitnahe Informationen zur Entwicklung der erneuerbaren Energien im Jahresverlauf sind ein wichtiger Indikator für den Fortschritt der Energiewende. Ergänzend zu den Zeitreihen auf Jahresbasis veröffentlicht die Arbeitsgruppe Erneuerbare Energien-Statistik (AGEE-Stat) deshalb an dieser Stelle Monats- und Quartalsdaten für das laufende Jahr.

Umweltbundesamt

#GermanEnergyFact #22: #renewable #electricity generation in 🇩🇪 since 1990

I'm concluding my week on #renewables with a time series of renewable electricity generation.

▶️ Early 90s: < 20 TWh, most of it hydro power.
▶️ 2022: 253 TWh, more than 13 times as much than 1990.
▶️ Most of the growth came from #wind and #solar power.
▶️ This number has to grow >1000 TWh by 2045 in most relevant climate-neutrality scenarios.

Sources: #BMWK (https://www.erneuerbare-energien.de/EE/Navigation/DE/Service/Erneuerbare_Energien_in_Zahlen/Zeitreihen/zeitreihen.html) and #AGEE-Stat (https://www.umweltbundesamt.de/themen/klima-energie/erneuerbare-energien/erneuerbare-energien-in-zahlen/monats-quartalsdaten-der-agee-stat#Quartalsdaten)

Zeitreihen Erneuerbare Energien

Zeitreihen Erneuerbare Energien

#GermanEnergyFact #23: Feed-in tariffs for rooftop #solar #PV 💶 ☀️

Feed-in tariff for new small-scale rooftop PV installations <30kW in the year 2004:
57.40 ct/kWh

Feed-in tariff for the same new installation in July 2022:
6.06 ct/kWh

Note: The respective feed-in tariffs are granted for 20 years after installation. And both are in nominal prices - i.e. the degression in real terms has been much higher than this.

#learningcurve #degressionatwork #thishasbecomereallydarncheap

#GermanEnergyFact #24: A bit more on feed-in tariffs for rooftop #solar #PV

In August 2022, the FIT for new rooftop PV installations <40kW in 🇩🇪 *increased* again, from 6.06 ct/kWh to 7.10 ct/kWh, or to even 10.90 ct/kWh in case all electricity is fed to the grid and nothing is self-consumed.

The latter is intended to provide an incentive to install the largest possible systems on the entire roof area and not go for smaller installations oriented at maximizing the self-consumption share.

#GermanEnergyFact #24 ctd.

So we are currently trying to incentivize grid feed-in of solar #PV via higher feed-in tariffs to make it more attractive compared to self-consumption.

Fun fact: around 15 years ago, we had the opposite situation: self-consumption was not profitable (retail prices were lower and FITs were very high), so in 2009 a 25 ct/kWh bonus was introduced for self-consumed electricity.

The people who locked this in for 20 years must be really happy today...

#GermanEnergyFact #25: remuneration for utility-scale solar #PV

While the FIT for rooftop PV installations <40kW in 🇩🇪 is currently 7.1 ct/kWh (or even 10.9 ct/kWh in case no electricity is self-consumed), remuneration for utility-scale PV is markedly lower. In Nov 2022, the last auction brought an average strike price of 5.8 ct/kWh.

Utility-scale PV operators receive the difference between this price and the average monthly market value of all PV plants as a premium.

https://www.bundesnetzagentur.de/DE/Fachthemen/ElektrizitaetundGas/Ausschreibungen/Solaranlagen1/Gebotstermin01112022/start.html

Bundesnetzagentur - Gebotstermin 1. November 2022

Gebotstermin 1. November 2022

Hm, it seems I forgot to post a #GermanEnergyFact yesterday. How come no one noticed? 😉

So, here is #GermanEnergyFact #26: remuneration vs. market value of #solar #PV in 🇩🇪

▶️ 5.8 ct/kWh: strike price for utility-scale solar in the last auction (Nov 2022)
▶️ 7.1 ct/kWh: current feed-in tariff < 40 kW
▶️ 10.9 ct/kWh: current feed-in tariff < 40 kW in case of full grid feed-in
▶️ 22.3 ct/kWh: average yearly market value of solar PV in 🇩🇪 2022 🤯

#crazytimes

Source: https://www.netztransparenz.de/EEG/Marktpraemie/Marktwerte

Netztransparenz > EEG > Marktprämie/Marktwerte > Marktwerte

#GermanEnergyFact #27: market values of variable #renewables 2022

2022 saw not only record-breaking electricity prices, but also extraordinary market values for #wind and #solar. Average spot price and market values:

▶️ Solar #PV: 22.3 ct/kWh (95% of average prices)
▶️ #Offshore wind: 18.3 ct/kWh (78%)
▶️ #Onshore wind: 16.3 ct/kWh (69%)

Data: https://www.netztransparenz.de/EEG/Marktpraemie/Marktwerte

Netztransparenz > EEG > Marktprämie/Marktwerte > Marktwerte

Since I'm still a day behind, here comes another one right away, #GermanEnergyFact #28: average yearly market values of #wind and #solar power in 🇩🇪 since 2020

▶️ Market values generally followed the exploding market price.
▶️ There seems to be increasing "cannibalization" of wind power.
▶️ I don't see why the market value of PV (relatively) increased in 2022. As the monthly values also look differently, there may be a data error. Anyone who knows more about this? @aurelwuensch @marcowuensch

@wpschill @aurelwuensch @marcowuensch Just a guess, but can it be an effect due to the missing transmission lines from north to south? Wind generation in the north needs to be stopped while coal and gas are used in the south causing higher market prices at that specific time. Solar is affected less because it is also present in the south and can take a benefit from the high market prices at these times.
@sebastianbe @wpschill @aurelwuensch @marcowuensch wind redispatch in the North has no effect on the energy balance.