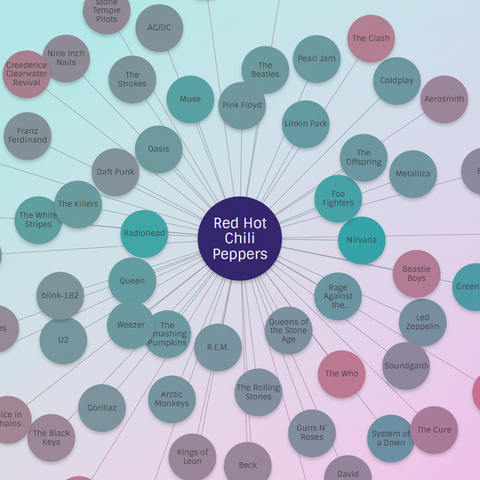
I thought I understood the colour coded bar on the right-hand side of the Super G coverage. It seemed quite obvious (and nicely detailed).

And then there's people with a section that's almost all green, a little yellow and maybe one gate is light red. And then they lose 0.01s over the sector!

#Olympics #Skiing #Visualisations

"Playing a “magic” piano that lets you see music—no AI, no CGI"

Very cool! I like the various experimentations and explanations 🙂

https://thekidshouldseethis.com/post/piano-music-bioluminescent-visualization-htx-studio

#Music #Visualisations #NoAI #RealEffects #TechnicalEffects

Playing a "magic" piano that lets you see music—no AI, no CGI

When He Tongxue (何同学) began learning how to play the piano, "something felt missing," he explains. "For centuries, piano music was only heard, never seen.

The Kid Should See This

Resisting Conway’s law through more thoughtful mapping

Organisational structures and information architectures are both often visualised in artefacts described as “maps”. These constrained visualisations may embed siloed ways of working, and create problems for our users.

https://duncanstephen.net/resisting-conways-law-through-more-thoughtful-mapping/

Story Map

Free online tool for creating map-based visualisations (with captions, markers, photos). A lot of different options and customisations.

https://storymap.knightlab.com/

#geoint #visualisations

Adding interactivity to #graphs helps viewers to engage 👀

This #TrainingTuesday, this lesson on #interactive #visualisations from Programming Historian provides an overview of what Plotly is, why it’s useful, and how it can be used with #Python.

➡️ Check it out on DARIAH Campus: https://buff.ly/rxo3cha

Creating Interactive Visualizations with Plotly

This lesson demonstrates how to create interactive data visualizations in Python with Plotly's open-source graphing libraries using materials from the Historical Violence Database.

This guide will help you with all of the #data -related aspects of your publication: writing about data, creating data #visualisations , and preparing and publishing data. It will provide you with tips and resources that will make the data in your publication more #accessible and #reusable. https://data.europa.eu/apps/data-in-publications-guide/
Data in Publications Guide

Tips and resources that make the data in your government publication more accessible and reusable.

Data in Publications Guide
Visualisation - Spatial Distribution Of Population Changes With Age In And Around London, UK
--
https://www.linkedin.com/feed/update/urn:li:activity:7189190935690293248
--
[some beautiful AND enlightening use of animated maps, makes us #spatialgeeks want to get in there and pull the data apart with our bare hands (sic), so many use cases...]
“Earlier this week in a workshop for the Data Science & Analytics team at [UK Ordnance Survey], [they] looked at creating animated maps.
[They] used 2021 Census data reported at MSOA level to look at how the spatial distribution of population changes with age in and around London. The trend between ages 25 to 50 of young people progressively moving away from central London is fun to see..."
#GIS #spatial #mapping #cartography #maps #animated #visualisation #visualisations #census #age #demographics #London #England #UK #Britain #opensource #development #workshop #training #animatedmaps #MSOA #population #change #spatialanalysis #matplotlib #geopandas #imagemagick
@OrdnanceSurvey
Tom Peterken on LinkedIn: Earlier this week in a workshop for the Data Science & Analytics team at…

Earlier this week in a workshop for the Data Science & Analytics team at OS, we looked at creating animated maps. We used 2021 Census data reported at MSOA…

Hans Rosling's 200 Countries, 200 Years, 4 Minutes - The Joy of Stats - BBC Four

YouTube

#ListenBrainz #MusicNeighbourhood is live!

Use arcane technology to find your favourite artist and explore their related artists. Watch the pretty colours. Listen to the music. Race your friends from Napalm Death to Britney Spears. Increase the web size and gasp as the artists jiggle into each other. Or simplify your life by exploring a web size of 0.

No account required: https://listenbrainz.org/explore/
Blog post: https://blog.metabrainz.org/2024/01/31/listenbrainz-music-neighborhood/
#musicdata #musicbrainz #visualisations

ListenBrainz

Track, explore, visualise and share the music you listen to. Follow your favourites and discover great new music.

Doing some background research for a [thing], I came across these C17th French #visualisations of elements of #philosophy by Martin Meurisse and Léonard Gaultier and they’re rather intriguing…: https://publicdomainreview.org/essay/the-art-of-philosophy-visualising-aristotle-in-early-17th-century-paris/
The Art of Philosophy: Visualising Aristotle in Early 17th-Century Paris

With their elaborate interplay of image and text, the several large-scale prints designed by the French friar Martin Meurisse to communicate Aristotelian thought are wonderfully impressive creations. Susanna Berger explores the function of these complex works, and how such visual commentaries not only served to express philosophical ideas in a novel way but also engendered their own unique mode of thinking.

The Public Domain Review