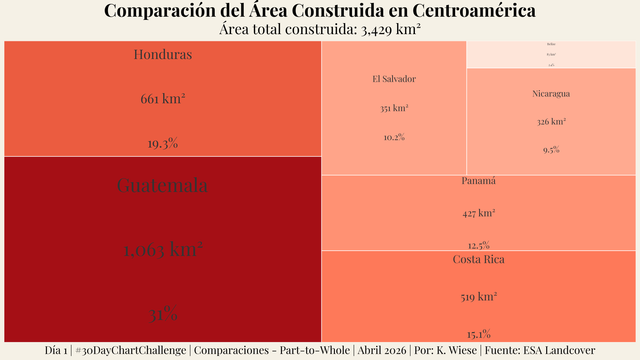
Día 1 | Comparaciones – Part-to-Whole | #30DayChartChallenge. Distribución del área construida en Centroamérica según ESA WorldCover, donde el tamaño refleja los km² de suelo urbanizado por país. El gráfico fue creada usando R con los paquetes #ggplot2, #treemapify, #scales y #showtext.
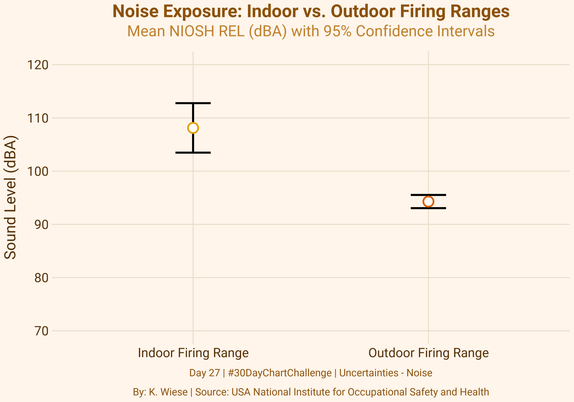
Day 27 | Uncertainties – Noise | #30DayChartChallenge. Visualization made with R using #ggplot2, #showtext and #dplyr | Source: USA - National Institute for Occupational Safety and Health.