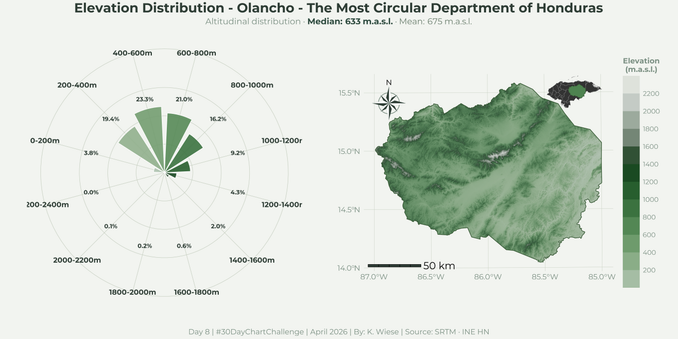
#Day8 | Distributions – Circular | #30DayChartChallenge | Elevation distribution in the most circular department of Honduras. Built with #RStats using #sf, #raster, #exactextractr, #ggplot2, #ggnewscale, #ggtext, #dplyr, #terra, #showtext, #scales, #patchwork and #ggspatial.
Día 8 | Distribuciones – Histograma | #30DayChartChallenge. | Visualización hecha usando R con los paquetes #ggplot2, #dplyr, #patchwork, #sf, #ggtext, #showtext, #raster, #exactextractr, #ggscale y #scales.
Día 9 | Distribuciones – Divergente | #30DatChartChallenge. | Visualización hecha usando R con los paquetes #ggplot2, #dplyr, #patchwork, #sf, #ggtext, #showtext, #raster, #exactextractr and #SPEI.