Plotting a grid over a simple feature (sf) object using ggplot2
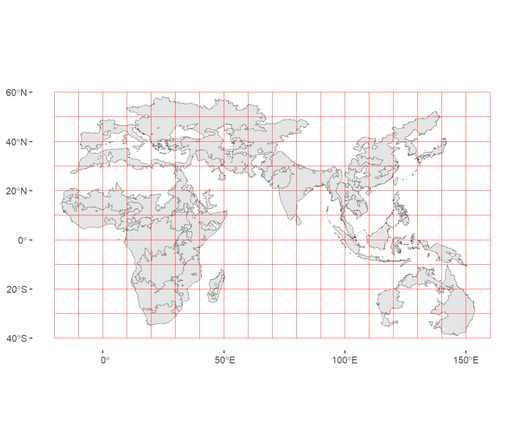
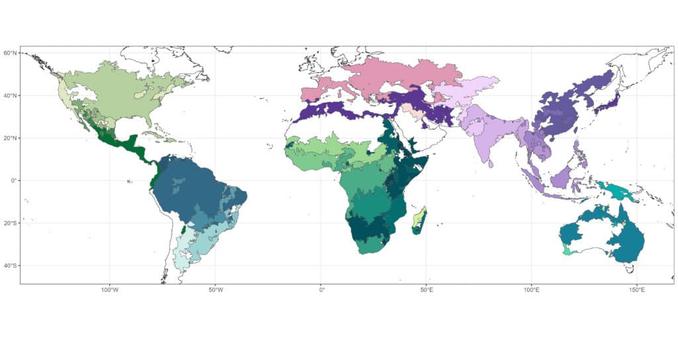
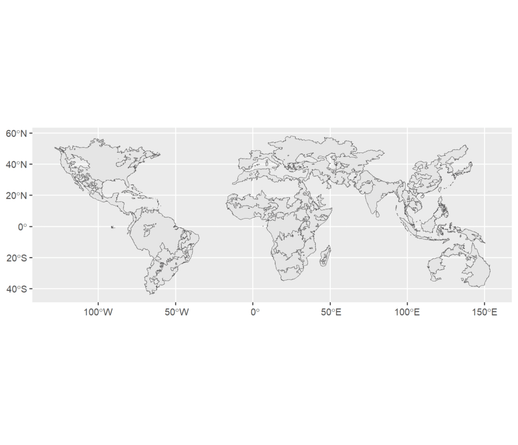
Plotting a grid over a simple feature (sf) object using ggplot2 How do you plot a grid over shapefile polygons using R? A straightforward procedure with a surprising lack of clear information on the internet. This post will cover how to create a grid using the Terra package, how to plot shapefiles with ggplot2 and the tidyterra package, and give some insights into spatial visualization for your projects! I've also included all the code as an annotated r-script you can download below. Let's […]https://learnadv.com/guides/plotting-a-grid-over-sf-object-using-ggplot2/