How to create a user story map with a Miro table
Thanks to some truly inspirational collaboration with my colleagues Martin and David recently, we've figured out a way to create a user story map from a Miro table.
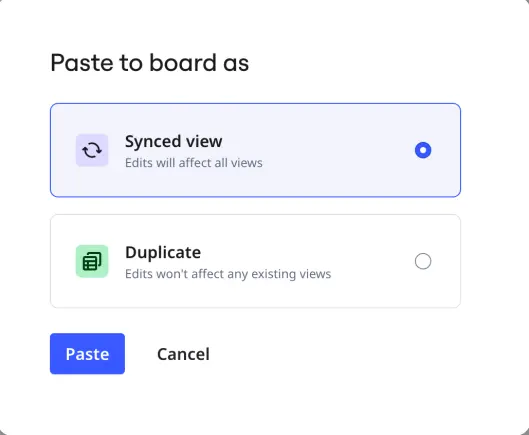
Best of all, the story map and the table are synced. So if you update one, the other updates at the same time. No need to maintain two artefacts, or copy/paste anything. Two views. One underlying reality.
Here's how.
Start with user needs
As you do your research, compile a table of the user needs you discover. You can add as many columns, of whatever type, as you need.
Record which persona/user(s), and which stage in the journey it occurs.
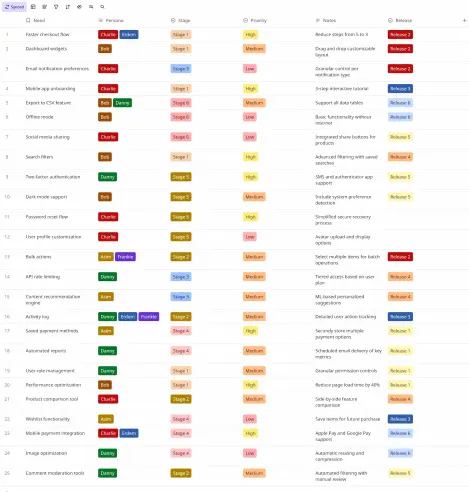
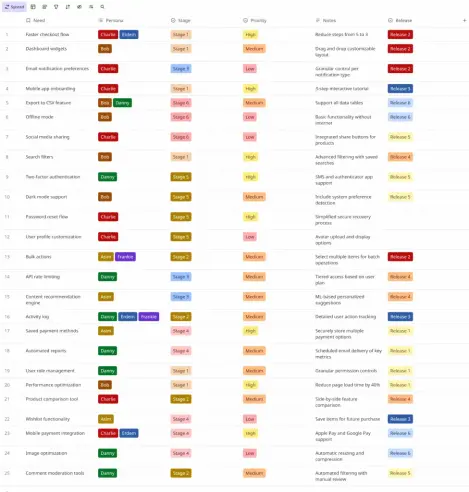
You'll end up with a table something like this.
A table of user needs documented in Miro. It includes Stage and Release columns, which we'll need later, but everything else is completely up to you – add, remove or change columns as you need.
[…]
https://design.scotentblog.co.uk/how-to-create-a-user-story-map-with-a-miro-table/