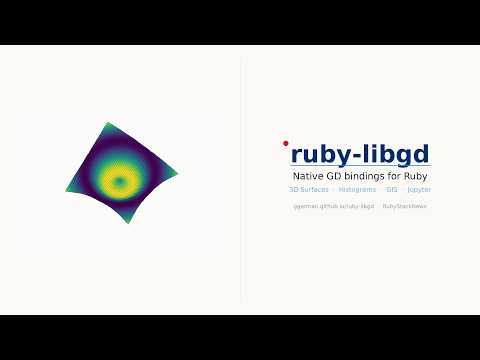
Ruby-LibGD with 2D/3D Plots in Jupyter
Learn how to use ruby-libgd to create stunning 2D and 3D plots directly in Jupyter Notebooks! In this comprehensive tutorial, we'll explore the powerful graphics capabilities of ruby-libgd, from basic functions to advanced 3D visualization.
#Ruby #DataVisualization #Jupyter #LibGD #Programming #GraphicsProgramming #3DPlots #Coding #Tutorial #DataScience