“Standard trade models underestimate the impact because they miss the bottleneck mechanism: energy disruptions cascade through chemicals and fertilizer production into food prices, amplifying losses for the world’s poorest countries.”

Kiel Policy Brief #KielInstitute

Authors Hinz J. Mahlkow H. Sogalla R. Willmann G.

#EnergySecurity #FoodPrices #Geoeconomics
Emerging Markets & Developing Countries

International Trade

https://bsky.app/profile/chadbourn.bsky.social/post/3mhuu2ta2ds2e

Mark Chadbourn (@chadbourn.bsky.social)

“Standard trade models underestimate the impact because they miss the bottleneck mechanism: energy disruptions cascade through chemicals and fertilizer production into food prices, amplifying losses for the world’s poorest countries.” https://www.kielinstitut.de/publications/the-cost-of-closing-the-strait-of-hormuz-energy-bottlenecks-and-global-food-security-19613/

Bluesky Social

#UkraineSupportTracker of the #KielInstitute tracking aid to 🇺🇦 #Ukraine

Update up to December 2025

Aid allocations

💶 Total: 343 Billion Euros
(🇪🇺Europe [1]: 53% 🇺🇸USA: 28% 🇷🇺Russia [2]: 13% 🇺🇳Others: 6%)

By year

📆 2022: 78 Billions €
(🇪🇺Eur: 48% 🇺🇸USA: 45% 🇺🇳Oth: 7%)

📆 2023: 88 Billions €
(🇪🇺Eur: 53% 🇺🇸USA: 38% 🇺🇳Oth: 9%)

📆 2024: 97 Billions €
(🇪🇺Eur: 45% 🇺🇸USA: 27% 🇷🇺Rus: 21% 🇺🇳Oth: 7%)

📆 2025: 80 Billions €
(🇪🇺Eur: 69% 🇷🇺Rus: 29% 🇺🇳Oth: 2% 🇺🇸USA: 1%)

#NAFO #Ukrainerussiawar

#UkraineSupportTracker of the #KielInstitute tracking aid to 🇺🇦 #Ukraine

Update up to December 2025

Allocations as a percentage of GDP (2021)
(contributions from EU common institutions and EU member states combined)

%GDP
1🇳🇴 #Norway: 2,2%
2🇪🇺 #EuropeanUnion: 1,2%
3🇨🇦 #Canada: 0,8%
4🇬🇧 #UK: 0,7%
5🇺🇸 #USA: 0,6%
6🇮🇸 #Iceland: 0,4%
7🇯🇵 #Japan:0,3%
8🇨🇭 #Switzerland: 0,2%
9🇦🇺 #Australia: 0,1%
10🇰🇷 #SouthKorea: 0,1%
11🇳🇿 #NewZealand: 0,1%

#NAFO #Ukrainerussiawar

#UkraineSupportTracker

Despite the halt of US support, the volume of aid allocated to Ukraine remained relatively stable in 2025, primarily due to the expanded support from Europe.

European military aid rose by 67%, while non-military aid increased by 59% .

🇩🇪 🇺🇦
The #KielInstitute is a German research center that investigates drivers and effects of international economy
It tracks international support to #Ukraine every two months
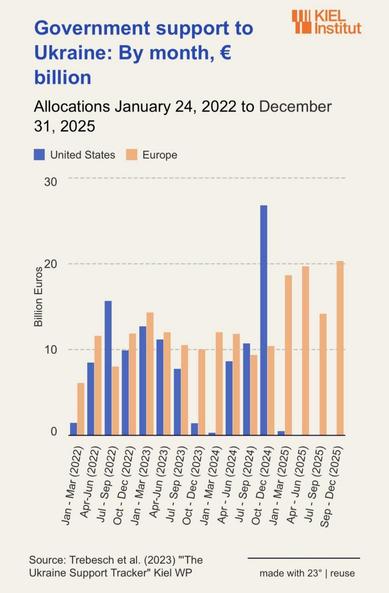
https://www.kielinstitut.de/publications/news/ukraine-support-after-4-years-of-war-europe-steps-up/

#russia #Ukrainerussiawar #NAFO

Ukraine support after 4 years of war: Europe steps up

Despite the halt of US support, the total volume of aid allocated to Ukraine remained relatively stable in 2025, primarily due to the markedly expanded support from Europe. European military aid rose by 67 percent above the 2022–2024 average, while non-military aid increased by 59 percent. Military aid is increasingly borne by only a small number of countries, while financial aid now mainly comes from EU institutions. These are among the key findings in the latest data update and Kiel Policy Brief of the Ukraine Support Tracker, covering data through December 2025.

#UkraineSupportTracker of the #KielInstitute tracking aid to 🇺🇦#Ukraine

Update up to December 2025

Allocations as a percentage of GDP (2021)
-Contributions by #EU distributed among Member States

%GDP
1 🇩🇰#Denmark: 3,8%
2 🇪🇪#Estonia: 3,6%
3 🇱🇹#Lithuania: 3,0%
4 🇱🇻#Latvia: 2,5%
7 🇳🇴#Norway: 2,2%
5 🇸🇪#Sweden: 2,2%
6 🇫🇮#Finland: 2,0%
8 🇳🇱#Netherlands: 1,7%
9 🇵🇱#Poland: 1,6%
11🇸🇰#Slovakia: 1,3%
10🇧🇪#Belgium: 1,3%
13🇩🇪#Germany: 1,2%
12🇭🇷#Croatia: 1,2%
14🇫🇷#France: 0,9%
15🇧🇬#Bulgaria: 0,9%

#NAFO #Ukrainerussiawar

#UkraineSupportTracker of the #KielInstitute tracking aid to 🇺🇦 #Ukraine
Update up to December 2025

Aid allocations in billions Euros by country

Total
- 🇪🇺 EU Total aid: 172 Bn€
1🇺🇸#USA: 115 Bn€
2🇪🇺#EU common institutions: 84 Bn€
3🇩🇪#Germany: 25 Bn€
4🇬🇧#UK: 19 Bn€
5🇨🇦#Canada: 14 Bn€
6🇩🇰#Denmark: 11 Bn€
7🇯🇵#Japan: 11 Bn€

Military
- 🇪🇺 EU total aid: 71 Bn€
1🇺🇸#USA: 65 Bn€
2🇩🇪#Germany: 20 Bn€
3🇬🇧#UK: 14 Bn€
4🇩🇰#Denmark: 10 Bn€
5🇳🇱#Netherlands: 9 Bn€
6🇸🇪#Sweden: 8 Bn€
7🇫🇷#France: 6 Bn€

#NAFO #Ukrainerussiawar

more #data to support this claim:

96% of the weight of the #tariffs ends up being carried by #US consumers.
while the world around them finds new ways to trade around them, see #Mercosur.

So #europe should just let him continue -
it s good for europe, all of #america (minus the US), for china, -

https://www.kielinstitut.de/publications/news/americas-own-goal-americans-pay-almost-entirely-for-trumps-tariffs/

https://www.kielinstitut.de/publications/americas-own-goal-who-pays-the-tariffs-19398/

#kielinstitute

America's own goal: Americans pay almost entirely for Trump’s tariffs

Contrary to US government rhetoric, the cost of US import tariffs are not borne by foreign exporters. Instead, they hit the American economy itself. Importers and consumers in the US bear 96 percent of the tariff burden, according to new research from the Kiel Institute for the World Economy.

🚨 BREAKING: The Kiel Institute unleashes the shocking revelation that Americans are, in fact, paying their own tariffs! 🤯 Who would've guessed that self-imposed taxes hit the wallet of the taxpayer?! Next up: water is wet and the sky is blue. 🌧️🔵
https://www.kielinstitut.de/publications/americas-own-goal-who-pays-the-tariffs-19398/ #BreakingNews #Tariffs #Taxpayer #Awareness #KielInstitute #EconomicInsights #HackerNews #ngated
America’s Own Goal: Who Pays the Tariffs? - Kiel Institute

#UkraineSupportTracker of the #KielInstitute tracking aid to 🇺🇦 #Ukraine

Aid to Ukraine from Europe and USA over time

The chart shows how Republicans in the United States Congress stopped aid to Ukraine twice: for 6 months in 2023-2024 and then again for 10 months in 2025.

Note:
All Republicans (except one Don Bacon), and not only Trump and MAGA: Republicans in Congress can ovverride Trump's veto whenever they want, they just don't want.

#Ukrainerussiawar #NAFO #UnitedStates #Republicans