🚀 geoviz v1.0 released! 🥳
- Code: https://github.com/riatelab/geoviz
- Documentation: https://riatelab.github.io/geoviz/
🚀 geoviz v1.0 released! 🥳
- Code: https://github.com/riatelab/geoviz
- Documentation: https://riatelab.github.io/geoviz/
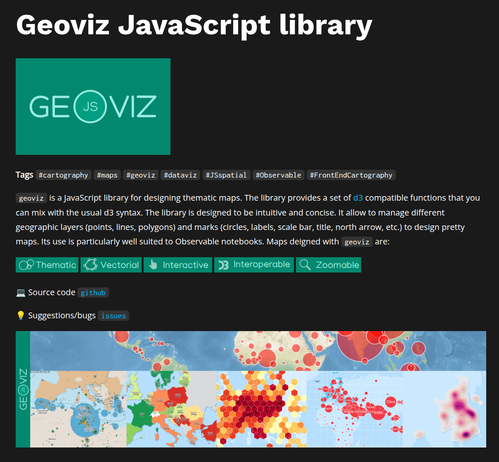

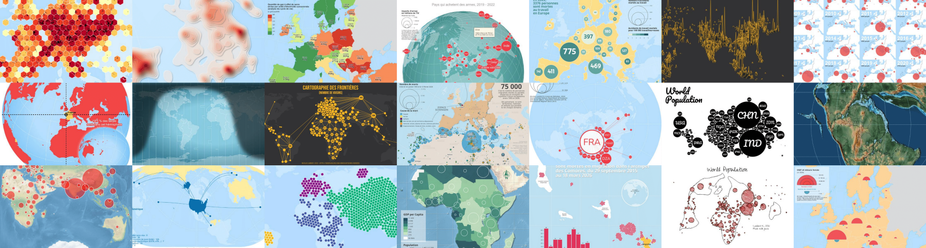
<mark>geoviz</mark> is a JavaScript library for designing thematic maps. The library provides a set of d3 compatible functions that you can mix with the usual d3 syntax. The library is designed to be intuitive and concise. Its use is particularly well suited to Observable notebooks. Maps deigned with `geoviz` are: `npm` - https://www.npmjs.com/package/geoviz `github` - https://github.com/riatelab/geoviz `API reference` - https://riatelab.github.io/geoviz/ To load the library: An example of zoomable thematic
<mark>geoviz</mark> is a JavaScript library for designing thematic maps. The library provides a set of d3 compatible functions that you can mix with the usual d3 syntax. The library is designed to be intuitive and concise. Its use is particularly well suited to Observable notebooks. Maps deigned with `geoviz` are: `npm` - https://www.npmjs.com/package/geoviz `github` - https://github.com/riatelab/geoviz `API reference` - https://riatelab.github.io/geoviz/ To load the library: An example of zoomable thematic

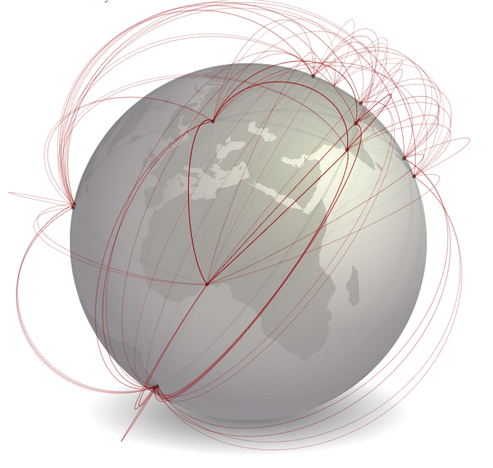
A globe view is available for some types of layers: `simple` (with symbol_shift == 0), `spikes`, `bubble` (with dorling == true), `geolines`, `graticule`, `inner`, `missing`, `shadow`, `tissot`, `dotdensity` and `label`. To use it, you juste have to use `"globe"` as projection. You can also define the center og the map by using `"globe(x,y,rotate)"` Simple globe Then let's build a simple globe. You can use the mouse to rotate the globe. Choropeth Bubble Spikes Data

Since version 1.7 of `bertin`, an update function function is available. It allows you to modify some specific attributes and styles without having to redraw the entire map. Not everything can be modified. Only the attributes <ins>underlined</ins> in the documentation are. Simple layer How it works? In 2 stages. First, we have to draw a map with the `draw` function. Then, we use the `update` function to modify things. For example, the fill as defined in a color input. Choropleth If your map is a choropleth