🪄 Dynamic simplification with #geoviz 🪄
https://observablehq.com/@neocartocnrs/dynamic-simplify @observablehq #JavaScript #Webmapping

«The official OSMnx reference paper has just been published open-access by Geographical Analysis: [link below] Years in the making, this article describes what OSMnx does and why it does it that way. But wait, there's more! I also discuss many lessons learned over the past decade in geospatial software development [...]» — @gboeing
Modeling and Analyzing Urban Networks and Amenities With OSMnx
https://onlinelibrary.wiley.com/doi/10.1111/gean.70009
#Python #OSMnx #geoviz #geopandas #FLOSS #geospatial #OpenAccess

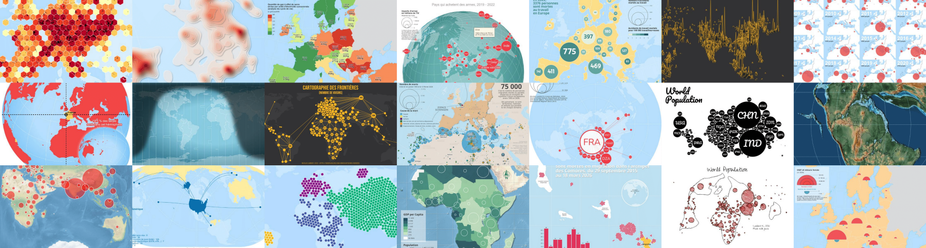
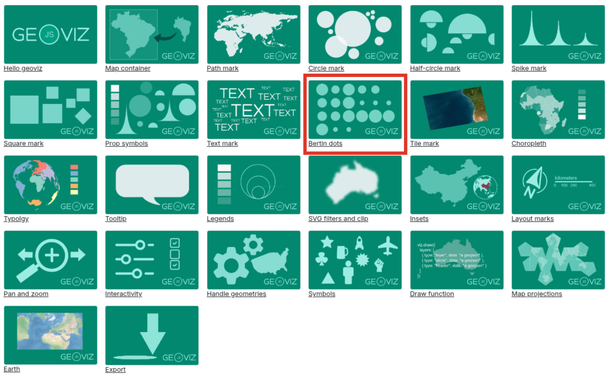
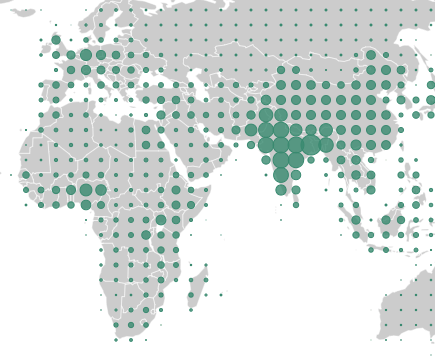
Have you tried the JavaScript library #geoviz?
👉 Observable live example: https://observablehq.com/@neocartocnrs/geoviz
👉 Vanilla examples: https://riatelab.github.io/geoviz/examples/
👉 code: https://github.com/riatelab/geoviz
👉 API documentation: https://riatelab.github.io/geoviz/


<mark>geoviz</mark> is a JavaScript library for designing thematic maps. The library provides a set of d3 compatible functions that you can mix with the usual d3 syntax. The library is designed to be intuitive and concise. Its use is particularly well suited to Observable notebooks. Maps deigned with `geoviz` are: `npm` - https://www.npmjs.com/package/geoviz `github` - https://github.com/riatelab/geoviz `API reference` - https://riatelab.github.io/geoviz/ To load the library: An example of zoomable thematic
I have added a few examples (without ObservableHQ) to the documentation of the #Geoviz JavaScript library.
Here's an example:
- Demo: https://riatelab.github.io/geoviz/examples/reactive.html
- Code: https://github.com/riatelab/geoviz/blob/main/examples/reactive.html
#GEOVIZ is a JavaScript library for designing zoomable and interactive thematic maps.
👉 github: https://github.com/riatelab/geoviz
👉 doc: https://riatelab.github.io/geoviz/
👉 live examples: https://observablehq.com/@neocartocnrs/geoviz
Work in progress.
Contributions are welcome 👋


Ever since antiquity, cartographers have been faced with the thorny question of how to draw a three-dimensional world in two dimensions on a sheet of paper or a screen. In other words, how do you go from sphere to plane? Try peeling an orange and laying its peel flat on the table in front of you. There are a thousand and one ways of doing this, and whatever your technique, there will be breaks and deformations. In the end, the image of the orange laid flat on the table will be nothing more than a distorted

