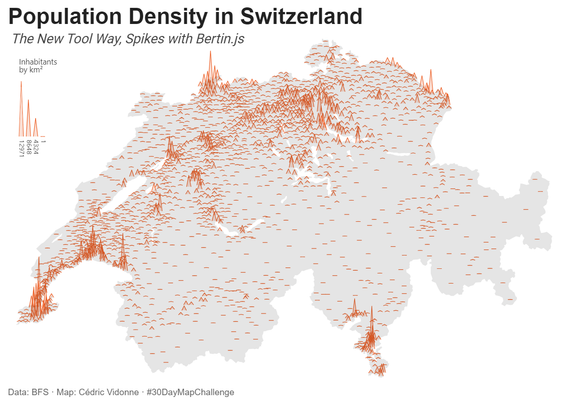
🌍 #30DayMapChallenge Day 13: New Tool!
Third take on population density in Switzerland, this time using Bertin.js to create a spike map! Impressed by the functionality of this library.
🌍 #30DayMapChallenge Day 13: New Tool!
Third take on population density in Switzerland, this time using Bertin.js to create a spike map! Impressed by the functionality of this library.
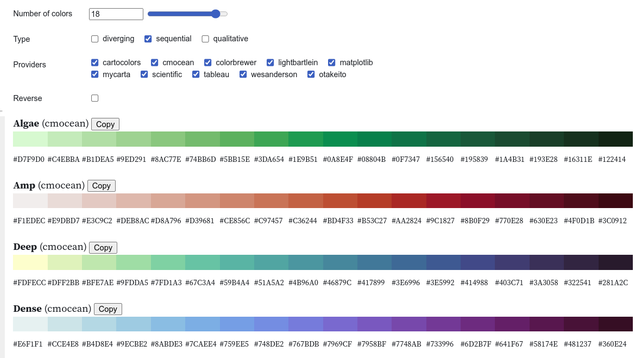
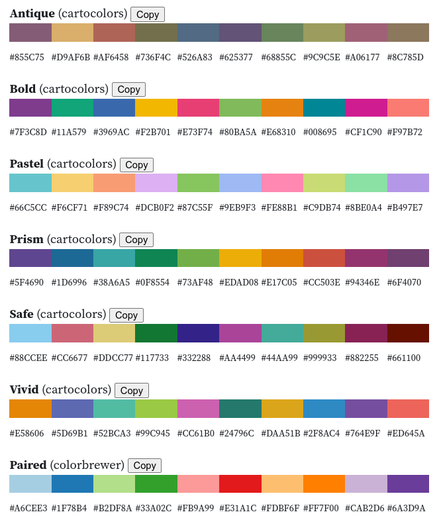

`dicopal` is a new JavaScript library that provides hundreds of color palettes. It is based on Colorbrewer2, CARTOColors, cmocean, Matplotlib, MyCarta, Tableau, (CUD) palette and many others... `npm` - https://npmjs.com/package/dicopal `github` - https://github.com/riatelab/dicopal.js `notebook` - https://observablehq.com/@mthh/hello-dicopal To load the library How it works? To find out how this library works, take a look at this notebook. Here, I'm just suggesting a way of retrieving the colors from the va
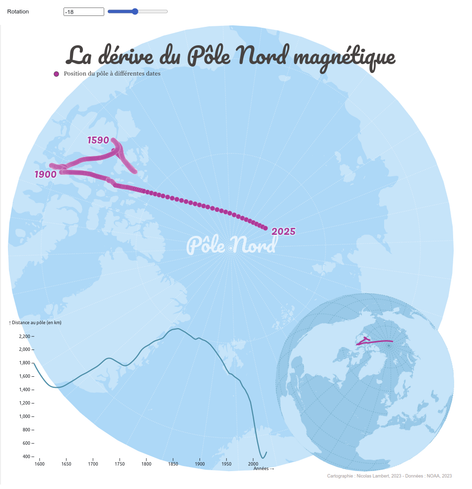

C'est bien connu, le Nord est en haut des cartes. Hum... Pas si sûr. En tout cas, pas si on considère le pôle nord magnétique qu'il ne faut pas confondre avec le pôle nord géographique terrestre (ou simplement, pôle Nord) situé à 90 degrés de latitude Nord. Ces deux points ne sont en effet pas confondus. Aujourd'hui en 2023, le pôle nord magnétique se situe en plein océan Arctique, à environ 430 km du pôle Nord. Mais en 1590, il se situait au nord de l'île Victora dans l'archipel arctique canadien. En 1859,

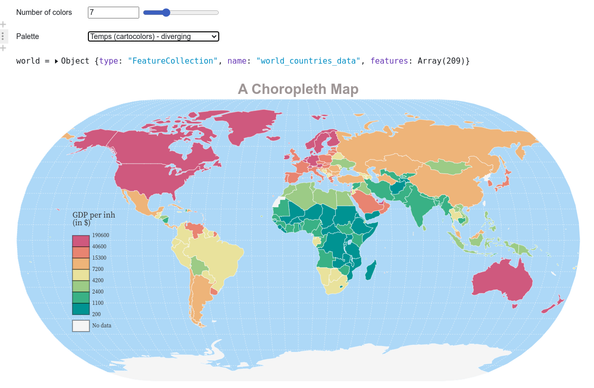
A globe view is available for some types of layers: `simple` (with symbol_shift == 0), `spikes`, `bubble` (with dorling == true), `geolines`, `graticule`, `inner`, `missing`, `shadow`, `tissot`, `dotdensity` and `label`. To use it, you juste have to use `"globe"` as projection. You can also define the center og the map by using `"globe(x,y,rotate)"` Simple globe Then let's build a simple globe. You can use the mouse to rotate the globe. Choropeth Bubble Spikes Data
The full 2017 download log of Sci-Hub. Originally published on the Sci-Hub Twitter account at https://twitter.com/Sci_Hub/status/954095639859814402 Republished here to provide a stable mirror of the data. The gunzipped file is ~14 GB in size. MD5 sum for gzipped file is 53c8a599e6467c8f4a62a32249c7e63c Columns in the data file: Timestamp (yyyy-MM-dd HH:mm:ss) DOI IP identifier User identifier Country according to GeoIP City according to GeoIP Latitude Longitude

, ** ** , . Geometries UCDP Battle-Related Deaths Dataset version 22.1 This file contains a dyad-year dataset with information on the number of battle-related deaths in the conflicts from 1989-2021 that appear in the UCDP/PRIO Armed Conflict Dataset. See https://ucdp.uu.se/downloads/index.html#armedconflict Texts Dependencies
 library (https://github.com/neocarto/bertin), since PR #92 and the 1.5.7 version, grid calculations taking polygons as input are up to 30x faster (depending on the number of input features and the resolution of the grid) thanks to the use of a spatial index 🎉.
bertin.js is an easy to use wrapper around d3js to facilitate the process of making thematic maps. The principle is to work with layers stacked on each other. As in a GIS, the layers that are displayed above are placed at the top in the code, the layers that are displayed below are placed at the bottom in the code. The layers that can be displayed are of several types: header, footer, graticule, outline, choro, typo, prop, shadow, scalebar, text... Each type has its own parameters. This list will be complet


