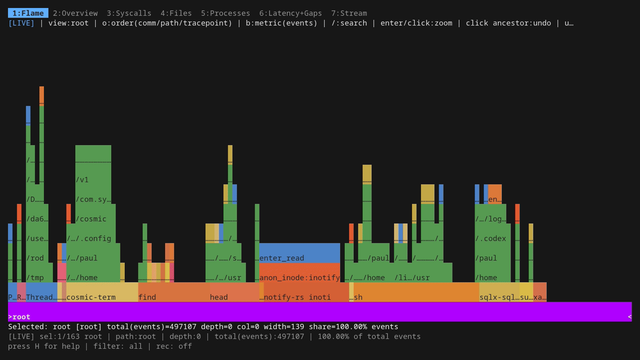
And then a nice presentation by Vinicius Grippa: Bringing #Flamegraphs to #MySQL Query Optimization. (https://github.com/vgrippa/myflame)
I love his brazilian accent... 🥰
GitHub - vgrippa/myflame: MySQL Query Stack visualizer

MySQL Query Stack visualizer. Contribute to vgrippa/myflame development by creating an account on GitHub.

GitHub
Ah, yes, yet another clash of the titans: Flame Graphs, Tree Maps, and #Sunbursts battling it out in a death match no one asked for, but everyone pretends to care about 🤷‍♂️. With more buzzwords than a Silicon Valley startup's pitch deck, this 2017 throwback is as relevant as a floppy disk in a cloud computing world 🌩️💾.
https://www.brendangregg.com/blog/2017-02-06/flamegraphs-vs-treemaps-vs-sunburst.html #FlameGraphs #TreeMaps #TechBuzzwords #2017Throwback #HackerNews #ngated
Flame Graphs vs Tree Maps vs Sunburst

Flame Graphs vs Tree Maps vs Sunburst explores different hierarchal visualizations by visualizing file system or disk space.

How to use #flamegraphs for #performance #profiling

https://runbooks.gitlab.com/tutorials/how_to_use_flamegraphs_for_perf_profiling/

Off-CPU Analysis - by Brendan Gregg:
https://www.brendangregg.com/offcpuanalysis.html

- On-CPU: where threads are spending time running on-CPU
- Off-CPU: where time is spent waiting while blocked on I/O, locks, timers, paging/swapping, etc.

#Testing #Perf #DataViz #DataVisualization #Flamegraph

How to use flamegraphs for performance profiling

Runbooks
Have been generating those CPU flame graphs on bare metal, so being able to use them in k8s seems to be pretty useful to me. https://www.percona.com/blog/kubernetes-observability-code-profiling-with-flame-graphs/ #flamegraphs #k8s #kubernetes
Kubernetes Observability: Code Profiling With Flame Graphs

Due to container complexity and security aspects, it’s challenging to achieve Kubernetes observability. However, kubectl-flame can automate profiling gathering.

Percona Database Performance Blog
“Hands up if you’re using #flamegraphs ” - 80% of the room #sre-next
The best software is the one, where you can't decide if something is a cool or a terribly ugly idea.
https://github.com/namhyung/uftrace
#linux, #ftrace but in userspace, #flamegraphs
GitHub - namhyung/uftrace: Function graph tracer for C/C++/Rust/Python

Function graph tracer for C/C++/Rust/Python. Contribute to namhyung/uftrace development by creating an account on GitHub.

GitHub
🌘 GNOME的Sysprof添加FlameGraphs以更好地可視化輸出-Phoronix
➤ GNOME的Sysprof添加了FlameGraphs以更好地可視化輸出
https://www.phoronix.com/news/GNOME-Sysprof-FlameGraphs
GNOME的Sysprof添加了FlameGraphs以更好地可視化系統分析工具的呼叫圖數據。
+ 這是一個很好的改進,讓人們更好地瞭解系統分析工具的呼叫圖數據。
+ 這將有助於GNOME的使用者更好地瞭解他們的系統,並更好地優化它們。
#GNOME #Sysprof #FlameGraphs #可視化
GNOME's Sysprof Adds FlameGraphs To Better Visualize Output

Brendan Gregg does some great talks. Just watched this one on #eBPF and #flamegraphs: https://www.youtube.com/watch?v=HKQR7wVapgk

Could understand about half but very interesting nonetheless

eBPF: Fueling New Flame Graphs & more • Brendan Gregg • YOW! 2022

YouTube
@[email protected] Perhaps it’s just me but I find #flamegraphs less useful as the profile grows in size and dominating effects weaken. Then it’s back to #JMC tabular data (usually itable stubs!) which I combine with a little #LogCompilation parser to get the JIT’s view on what’s happening.