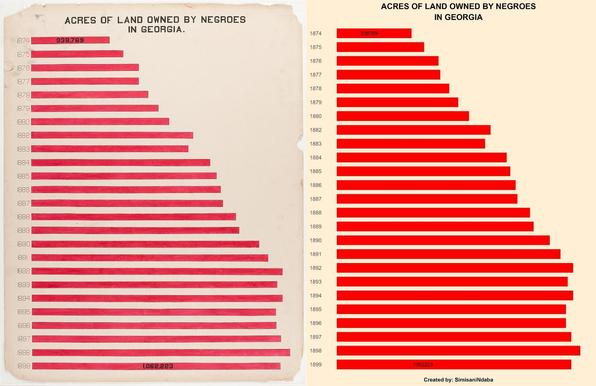
For my #DuboisChallenge2025 #DuboisChallenge week 2 entry
OG vs Re-creation
check out my #rstats #code 🔗 https://github.com/sndaba/2025DuBoisChallenge/tree/main/challenge2
For my #DuboisChallenge2025 #DuboisChallenge week 2 entry
OG vs Re-creation
check out my #rstats #code 🔗 https://github.com/sndaba/2025DuBoisChallenge/tree/main/challenge2
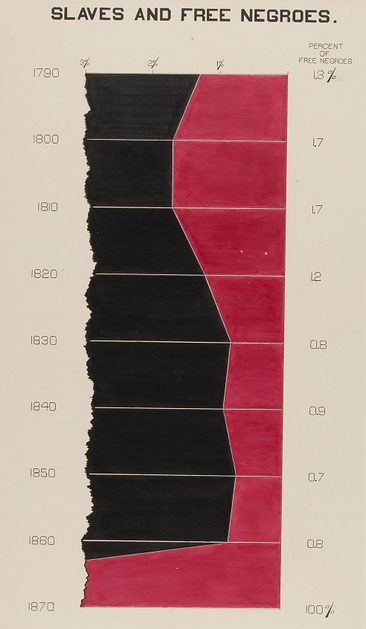
#duboischallenge2024 week05
here's my plate 13 re-creation to the challenge created using #rstats
#civilrights #blackhistorymonth #dataviz
#DuBoisChallenge
https://github.com/sndaba/2024DuBoisChallengeInRstats/blob/main/challenge05/challenge05.R

Angelica is joined by the wonderful Anthony Starks to discuss creative coding to create art & visualizations with Go. Anthony is an independent developer/designer interested in data visualization, generative art, building tools & combining art + code.
My attempt at this week's Du Bois Visualization Challenge.
I would have liked to recreate the hand-painted texture of fills and the ragged left edge of the plot. The package `ggpattern` provides some functions for creating non-solid fills, but I didn't see a way to do it in a purely programmatic way. And, sadly, there doesn't seem to be any `ggplot2` extension that does ragged edges.

The Du Bois #datavisualisation challenge! Datasets available in
https://github.com/ajstarks/dubois-data-portraits/tree/master/challenge/2023?mc_cid=3d9504ff09&mc_eid=61d46d000a#du-bois-visualization-challenge-2023
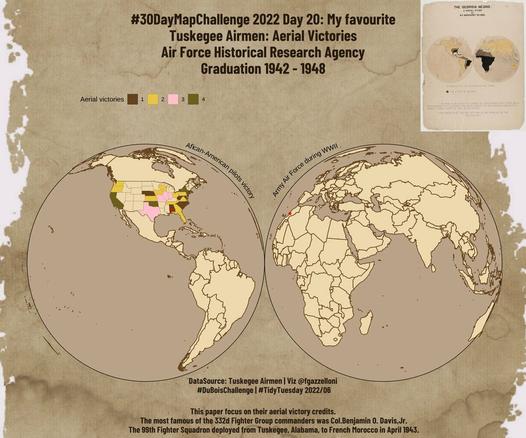
#30DayMapChallenge 2022 Day 20: My favourite
This one is from one of my #TidyTuesday for the #Duboischallenge Plate 1 @DuboisChallenge
GitHub:
- https://github.com/Fgazzelloni/30DayMapChallenge/tree/master/2022
- https://github.com/Fgazzelloni/TidyTuesday/tree/main/data/2022/w6_airforce
@tjukanov #rstats #rspatials #maps #globe #spatials #regions