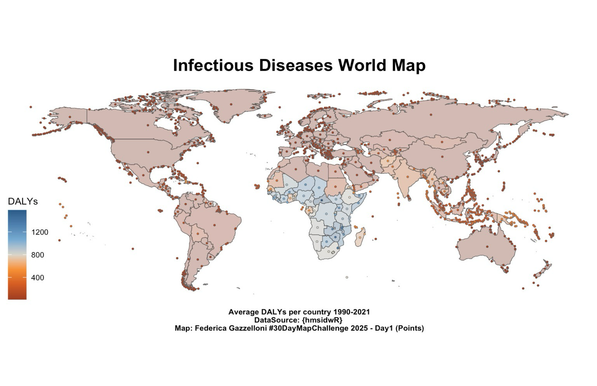
🌍 Day 1: Points
Starting #30DayMapChallenge 2025 with a map of DALYs (Disability-Adjusted Life Years) across countries — each point marks a population-weighted centroid, showing where health burdens hit hardest. R packages: {hmsidwR}, {sf}, {tidyverse}
#rspatials #RStats

📽 Recording Available: R for geospatial data science and public health surveillance. Whether you missed the live session or want to revisit the insightful discussions, you can access the recording 👇
🔗 https://rladiesrome.org/talks/2024/meetup/04162024/

@fgazzelloni @silacos
#Rspatials #datascience

R for geospatial data science and public health surveillance

Welcome to our April event! Join us for an engaging session with Dr. Paula Moraga, Assistant Professor of Statistics at KAUST, as she shares her insights and expertise in this domain. Don’t miss this opportunity to learn from a leading expert and explore the transformative potential of R in disease surveillance modeling!

💡 Join us as we explore the world of Geospatial with R!
Geospatial health data play a crucial role in informing public health and policy, identifying risk factors, and detecting outbreaks.

In this talk, Dr. Moraga will provide insights into R packages and statistical methods for geospatial data analysis and health surveillance.

#rladies #rspatials#rstats #datascience #geohealth

@RLadiesGlobal @fgazzelloni @silacos Rafaela Ribeiro Lucas

RSVP 👇
https://www.meetup.com/rladies-rome/events/299977481/

R for geospatial data science and public health surveillance, Tue, Apr 16, 2024, 6:00 PM | Meetup

**💡Join us as we learn about Geospatial with R**👇🏻 Geospatial health data are essential to inform public health and policy. These data can be used to understand geograp

Meetup
Unlocking the power of data visualization with R - 30DayMapChallenge 2023

#30DayMapChallenge 2023 #day29 Population
Kontur data for Ireland Population density and cities 🤩
Tools: #R, {ggspatial}, {cowplot}, {sf},..

#rspatials #rstats #datascience #maps #DataVisualization

#30DayMapChallenge 2023 Day 28: Is it a Chart or a Map?
Data: tmap::data(World)
Thanks to @bjnnowak and his examples!
Tool: #R, {cartogram},{sf}, {tmap},{tidyverse}
#rspatials #rstats #datascience #dataviz #maps
#30DayMapChallenge 2023 #day27 Dot
WorldCover_trees_30s data is sourced from the University of California, Davis Geospatial Data Repository, patterns of global tree coverage in 2022.
Tool: #R
#rspatials #rstats #maps #dataviz #datascience
#30DayMapChallenge 2023 #day26 Minimal
Download climate data with the `worldclim_country()` function from the `{geodata}` package. Then make the map with `geom_spatraster()` function from the `{tidyterra}` package.
#rspatials #rstats #maps
#30DayMapChallenge 2023 #day25 Antarctica
Found this amazing rOpenSci package {antanym}, which provides the names of locations in Antarctica and other features.
#rspatials #rstats #spatials #datascience #dataviz #maps