The map-enabled data exploration tool *mapdata.py* (https://pypi.org/project/mapdata/) will now produce a Lorenz curve for any numeric variable, optionally segregated by any categorical variable.

#DataAnalysis #DataExploration #DataViz #Plotting #LorenzCurve #Python #FOSS #FLOSS

RE: https://floss.social/@rdnielsen/116365121149129752

The third and last of the series on unmixing using NMF is now posted at

https://dblog.vitumbre.tech/dart/unmixing-using-nmf-part-3-assessing-accuracy-of-end-members/

Part 3 illustrates the variability of results that can occur when repeatedly unmixing the same data set, and presents approaches to addressing the resultant uncertainty.

#DataAnalysis #DataExploration #Unmixing #NMF #Python #JuliaLang #RStats

RE: https://floss.social/@rdnielsen/116363795536617194

Part 2 of this series on unmixing is now available:

https://dblog.vitumbre.tech/dart/unmixing-using-nmf-part-2-evaluating-the-number-of-end-members/

Part 2 addresses the challenge of deciding how many end members are in a data set, recommends algorithms for Python, Julia, and R, and illustrates how several factors affect that determination.

#DataAnalysis #DataExploration #Unmixing #NMF #Python #JuliaLang #RStats

I just posted part 1 of a 3-part series on unmixing of data sets using non-negative matrix factorization.

https://dblog.vitumbre.tech/dart/unmixing-using-non-negative-matrix-factorization-nmf-part-1-introduction-and-implementation/

Part 1 contains implementations in Python, Julia, and R, and includes an assessment of the relative accuracy of these implementations.

Parts 2 and 3 will follow shortly, and will contain more detail on the identification of, and accurate characterization of, unmixing end members.

#DataAnalysis #DataExploration #Python #JuliaLang #RStats #Unmixing #NMF

Unmixing Using Non-negative Matrix Factorization (NMF). Part 1: Introduction and Implementation

Data sets that can be represented as a matrix of cases (rows) and variables (columns) often have structure within them that is not immediately apparent. There are a number of techniques for identifying and characterizing hidden structure in data sets. Unmixing is a method that is appropriate when the data

Stones in my Shoe

The mapdata.py data explorer now has two new ways of summarizing missing data. It can also now create a Zipf's Law plot for any categorical variable. Install, update, or download it from PyPI: https://pypi.org/project/mapdata/

#DataExploration #DataAnalysis #Mapping #Plotting #Statistics #FOSS #FLOSS

🔍 Exploring groundwater chemistry — from ions to equilibrium

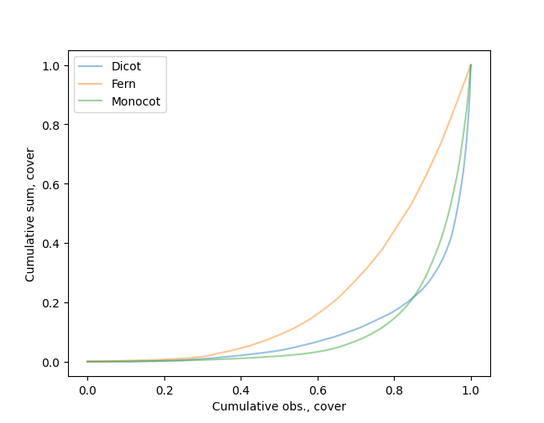
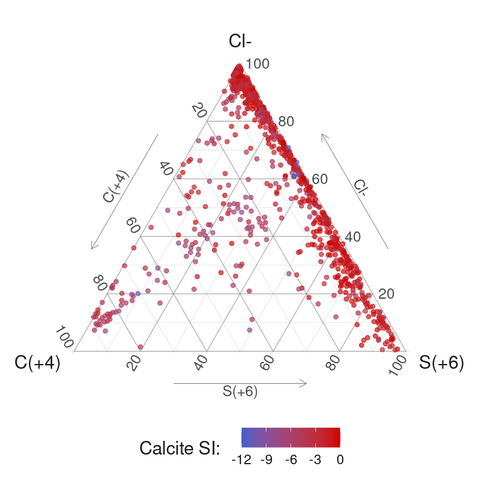
This ternary diagram shows how groundwater samples affected by mine water vary in anion composition. Each point represents one sample, colored by its calcite saturation index (SI) from PHREEQC calculations.

Such early-stage exploration helps reveal subtle geochemical trends — where equilibrium breaks down, reactions intensify, and contamination fronts begin to form.

🧪 Data exploration: PHREEQC + R

#Geochemistry #Hydrogeology #MineWater #Groundwater #PHREEQC #DataExploration #EnvironmentalGeochemistry #GeochemicalModeling #DataVisualization #RStats #OpenScience #SvystunovaGully

AGX – Open-Source Data Exploration for ClickHouse (The New Standard?)

https://github.com/agnosticeng/agx

#HackerNews #AGX #OpenSource #DataExploration #ClickHouse #TechNews #DataAnalysis

GitHub - agnosticeng/agx: Query and explore local and remote data with Clickhouse

Query and explore local and remote data with Clickhouse - agnosticeng/agx

GitHub

I'm not really sure when @micahflee made his Hacks, Leaks, and Revelations book free to read online, but if it's been on your wish list, now's your chance to give it a read, and if you enjoy it, and can afford to, support the author.

https://hacksandleaks.com/contents.html

Buy here: https://hacksandleaks.com/

#data #dataviz #DataVisualiaztion #DataExploration #books #HacksAndLeaks

Contents - Hacks, Leaks, and Revelations

Buy Hacks, Leaks, and Revelations: The Art of Analyzing Hacked and Leaked Data by Micah Lee.

I'm continuing to play with my music listening data, and i suspect that spotify (2017-2021) and plex (2022+) handle time zones differently and that I'm not properly accounting for that difference.

#DataExploration #PowerBI #MicrosoftFabric

Modern Data Science with SAS Viya & Python for Churn Models | CoListy
Learn data science with SAS Viya & Python to predict churn, manage data, deploy models, & use GitHub for collaboration.
#freeonlinelearning #colisty #courselist #moderndatascience #sasviyaworkbench #predictiveanalytics #dataengineering #machinelearning #customerchurnprediction #pythonandsasintegration #dataexploration

https://colisty.netlify.app/courses/modern-data-science-with-sas-viya-python-for-churn-models/

Modern Data Science with SAS Viya & Python for Churn Models

Learn data science with SAS Viya & Python to predict churn, manage data, deploy models, & use GitHub for collaboration.