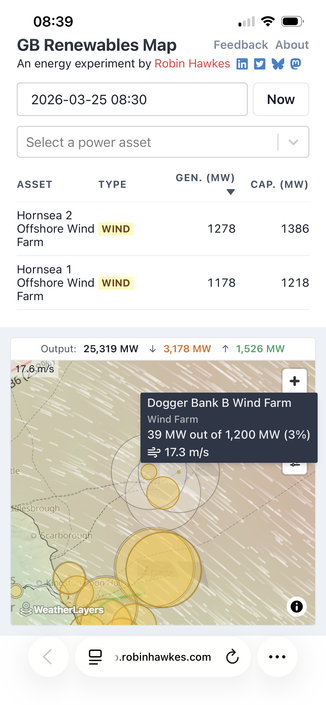
The sun is shining, the wind is blowing a gale, and just 3.4% of British electricity is coming from fossil fuels. See the live data at https://grid.iamkate.com.
@katemorley is 1.4GW a record low for gas? Don’t think I’ve seen it so low before
@drnoble @katemorley It's usually quite a bit higher just in case. They must be confident they won't need to switch it in suddenly.
@katemorley Could be on track to beat the 30.7GW of renewable energy generation on Tue, 17 Mar 2026. Just think, it could be 100% renewable were it not for the curtailment of wind generation due to poor infrastructure 😩 .
@katemorley That’s great, but my recycling bags are now in the next valley.
@katemorley That's a beautifully produced dashboard.
@katemorley could be an extra ~3.8gw of wind when the Dogger Bank and Sofia wind farms are at full potential.

@katemorley

What a very useful website. Thanks. Politicians bang on about the UK needing fossil fuels and nuclear, but it seems to me that we could repace them both with renewables, given a strong lead from the government.

@riggbeck @katemorley

Can't build nukes without nuke-lear. 🤷

@mndflayr @riggbeck @katemorley We can't store electricity at the moment so nuclear is the only carbon free back-up power. We will need to invest in alternative storage solutions. Batteries are the obvious alternative or pumping water up into hydro dams during over production of energy for example.

@johnhenrythe3rd @riggbeck @katemorley

Building storage is faster and cheaper than building nuclear power plants. 🤷

@riggbeck @katemorley
Sadly, we’re currently run by the world’s biggest wimps
@katemorley how relevant 😆😆😆
@katemorley I work at National Grid and have shared this in our Teams channels.
Don't be shocked if someone reaches out to offer you a job!
Great Britain | Electricity Maps

Track real-time and historical electricity data worldwide — see production mix, CO2 emissions, prices, cross-border exports, and much more.

@katemorley ...but we still have to pay for it as if it costs the same as natural gas: 🤔
@happyborg @katemorley Not necessarily, there are wholesale linked tariffs like Octopus Agile. My total electricity bill so far today is -97p (yes, minus).

@katemorley Thanks a lot, very interesting!
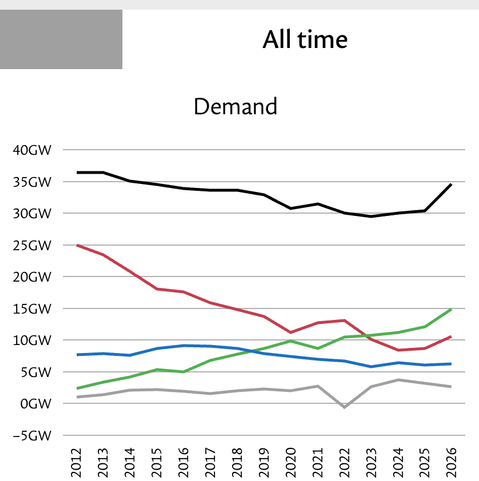
I'm curious about total all time demand. Why is the graph up so much for 2026? Simply because it's extrapolating based on high demand winter months? Or real increase?

Otherwise interesting the demand is trending down despite more usage put on the grid (heat pumps, EV…)

@fabienmarry Hopefully @katemorley can clarify, but my guess is that 2026 is still young and so far only has only had winter months flowing into what I assume is a mean value. I would definitely expect grid demand to be higher in winter.
(Regarding the downward trend of the 2010s, I think much of the developed world has seen a similar trend thanks to efficiency improvements in lighting & domestic appliances.)
@fabienmarry (Self-consumption/storage of private PV generation at scale alone will probably show up similarly, but offset by increased use of EVs and heat pumps as you say. So that'll be an interesting one to watch for sure.) /cc @katemorley
@fabienmarry @katemorley That graph is also really interesting as it shows how much reliance on fossil fuels has decreased over time
@fabienmarry @katemorley Heat pumps are more efficient than electric radiant heaters. EVs more efficient than petrol engines. Depends what the graphs include.
@katemorley that's awesome. Wonder if #taiwan has this. Forget the Olympics, we should have countries compete in these sorts of metrics.
@katemorley Fake news 😂 . My home solar is generating 4kw at the moment.
@johnhenrythe3rd @katemorley If it's anything like here rooftop PV isn't counted under generation, but under reduced load.
@katemorley we have solar panels and a battery. In the month so far, our house has used 327 kwh. 82% of that came from solar and the battery. On a sunny day in March, this rises to 90%. In June and July,our electricity costs are NEGATIVE. Imagine the impact if more solar was installed.
@katemorley well now I'm going to have spend the morning watching it like a hawk to see if we set a new wind record today!
@ahnlak @katemorley I'm guessing we'll have to curtail wind as the solar starts to add generation
@katemorley That's good but it assumes none of the power from interconnects with Europe is fossil. That's at 3.6%
Also - it's bloody cold and windy - good fro windfarms but bad for overall demand! March winds are fine but let's get spring back! 😀
@pa27 @katemorley But on the positive side solar PV works more efficiently when it is cold.
@katemorley have you considered exposing the mix from interconnects? I was pointed to https://www.rte-france.com/en/data-publications/eco2mix/power-generation-energy-source for France, for example.
éCO2mix - Power generation by energy source

Track real-time power generation in France per energy source based on remotely monitored data and forecasts.

@katemorley I guess the wind is blowing really hard because its having to squeeze through the narrow gap at the Straits of Hormuz? XD
@katemorley that's great, and really love your visualisation, but let's look at Paul Allen's (industrialised nation) energy consumption
@katemorley Definitely sunny and windy here.
@katemorley where have I been so far? I just discovered this.
Nice job!! And I'm amazed that renewables are doing so well
@katemorley
The wind blows a gale
The sun shines
The fossil lobby can bugger off
@katemorley
The situation is similar across Europe. For iOS users, the following app provides the latest figures:
https://apps.apple.com/app/id1224594248

@katemorley

Yet people are still paying for their electric as if was 100% produced by gas.

@katemorley Thanks for the site. I use it all the time to monitor the energy mix in the UK.
@katemorley snowing here on and off as well!
@katemorley thank you this thread and post made my morning its both informative, curious, and positive in a time I find most feeds the opposite. Great job improving the day!