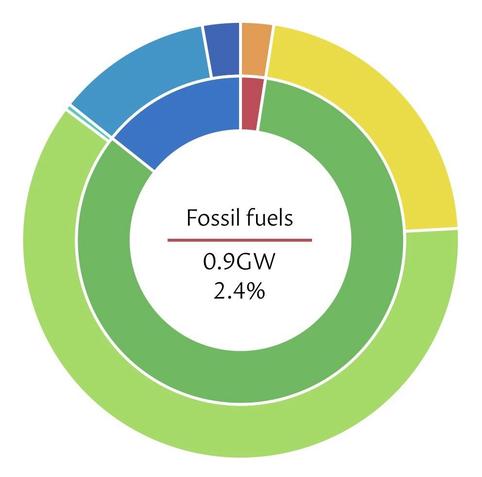
The sun is shining, the wind is blowing a gale, and just 2.4% of British electricity is coming from fossil fuels. See the live data at https://grid.iamkate.com.

@katemorley Thanks a lot, very interesting!
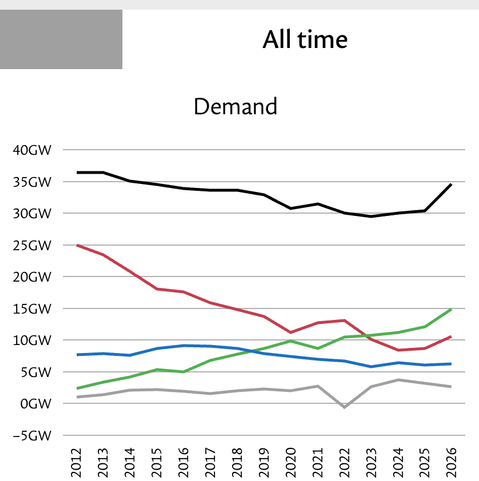
I'm curious about total all time demand. Why is the graph up so much for 2026? Simply because it's extrapolating based on high demand winter months? Or real increase?

Otherwise interesting the demand is trending down despite more usage put on the grid (heat pumps, EV…)

@fabienmarry Hopefully @katemorley can clarify, but my guess is that 2026 is still young and so far only has only had winter months flowing into what I assume is a mean value. I would definitely expect grid demand to be higher in winter.
(Regarding the downward trend of the 2010s, I think much of the developed world has seen a similar trend thanks to efficiency improvements in lighting & domestic appliances.)
@fabienmarry (Self-consumption/storage of private PV generation at scale alone will probably show up similarly, but offset by increased use of EVs and heat pumps as you say. So that'll be an interesting one to watch for sure.) /cc @katemorley