@DrRGST Reagan. It was Reagan in case anyone is wondering.


@smellsofbikes @DrRGST Yep, found the Reagan blamer.
Try Nixon: https://social.sdf.org/@mjgardner/112245785714516770
Mark Gardner (@[email protected])
@[email protected] @[email protected] Please note that before anyone blames #Reagan, that graph started to diverge and get shaky in the *early* 1970s. The apotheosis of #Keynes’ #economics was 1971’s #Nixon Shock; after that a brief reactionary blip into #Friedman’s #monetarism as the decade ended. We’ve been living with the worst of both worlds since the mid-80s as central planners try to ride herd on the #inflation of floating fiat currencies.

WTF happened in 1971? https://wtfhappenedin1971.com/

WTF Happened In 1971?
https://inflationdata.com/articles/2022/08/10/u-s-cumulative-inflation-since-1913/ "I don't believe we shall ever have a good money again before we take the thing out of the hands of government, that is, we can't take it violently out of the hands of government, all we can do is by some sly roundabout way introduce something that they can't stop." - F.A. Hayek…
@DrRGST #neoliberalism leads to #fascism through #unequality
Its worldwide visiting your country right now. #ElonMusk being a #billionaires thats the result of this
Its worldwide visiting your country right now. #ElonMusk being a #billionaires thats the result of this
@DrRGST "When the rate of return on capital exceeds the rate of growth of output and income, as it did in the nineteenth century and seems quite likely to do again in the twenty-first, capitalism automatically generates arbitrary and unsustainable inequalities that radically undermine the meritocratic values on which democratic societies are based." Thomas Piketty

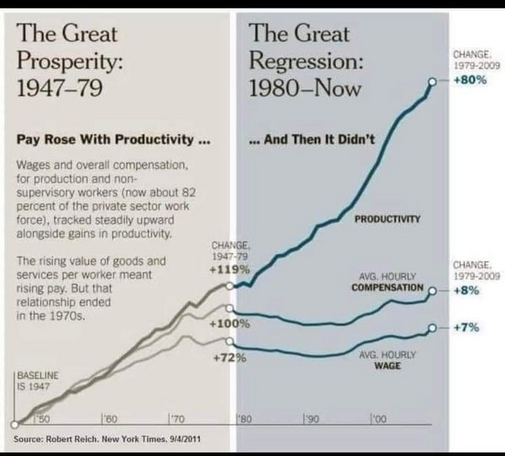
The Productivity–Pay Gap
The huge gap between rising incomes at the top and stagnating pay for the rest of us shows that workers are no longer benefiting from their rising productivity. Before 1979, worker pay and productivity grew in tandem. But since 1979, productivity has grown eight times faster than typical worker pay (hourly compensation of production/nonsupervisory workers).

@DrRGST End of the gold standard lead to inflation, which was curbed by monetary policy favoring capital over labor ("financialization", easier to divert to unproductive but hand picked things), capital outflows to countries with cheaper labor (great for technological progress in those countries, and making the rich richer, at the direct expense of everyone else), but the real banger was now governments could run persistent budget deficits, effectively salaries for votes instead of productivity.
Mark Gardner (@[email protected])
@[email protected] @[email protected] Please note that before anyone blames #Reagan, that graph started to diverge and get shaky in the *early* 1970s. The apotheosis of #Keynes’ #economics was 1971’s #Nixon Shock; after that a brief reactionary blip into #Friedman’s #monetarism as the decade ended. We’ve been living with the worst of both worlds since the mid-80s as central planners try to ride herd on the #inflation of floating fiat currencies.
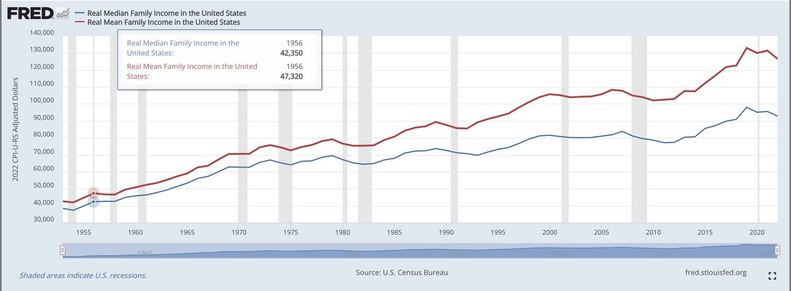
@DrRGST I was curious of how that trend has progressed to the present day, since that infographic only goes to ~2011. Strangely, this graph from U.S. Bureau of Labor Statistics looks very different from @[email protected] 's

@andrew I think using 2017 as the 100 percent mark has warped this significantly- because both productivity and wages will seem to converge there, but that is a completely arbitrary and incorrect view of things (you won’t see a diversion using the y axis as 100 percent for both)
@DrRGST yeah, neoliberalism started rearing its ugly head.
@DrRGST they want AI with even more productivity and less compensation.
The hunger is insatiable.
How about selling your likeness so that the movie industry can use them indefinitely.
@DrRGST @Radical_EgoCom Alt text: Chart
The Great Prosperity: 1947-79
Chart shows 119% productivity rise matched by 100% average hourly compensation and 79% average hourly wage increases.
Wages and overall compensation, for production and non-supervisory workers (now about 82 percent of the private sector work force), tracked steadily upward alongside gains in productivity. (1/2)
The rising value of goods and services per worker meant rising pay. But that relationship ended in the 1970s
The Great Regression: 1980-Now
Chart shows 80% productivity rise matched by 8% average hourly compensation and 7% average hourly wage increases. (2/2)

Ever get the feeling you've been cheated?
@DrRGST
Is this "trickle down economics" in action?
Is this "trickle down economics" in action?
@DrRGST We have very few cooperative businesses that would allow that to go on. Goldman Sachs used to be one.
@DrRGST Reagan... Not even once
Mark Gardner (@[email protected])
@[email protected] @[email protected] Please note that before anyone blames #Reagan, that graph started to diverge and get shaky in the *early* 1970s. The apotheosis of #Keynes’ #economics was 1971’s #Nixon Shock; after that a brief reactionary blip into #Friedman’s #monetarism as the decade ended. We’ve been living with the worst of both worlds since the mid-80s as central planners try to ride herd on the #inflation of floating fiat currencies.
@DrRGST Needs one more vertical line showing CEO pay!
@DrRGST As a Millennial, I was promised "The Good Times" that other generations had.
We did not get it.
We're supposed to be grateful for even that.
We did not get it.
We're supposed to be grateful for even that.

@DrRGST i love economical graphs where you can pinpoint exactly when reagan came into power
@unixorn hummm I wonder what could have happened in 1980 to cause that... it's a mystery
@opsnlops I know, it’s such a mystery.
Mark Gardner (@[email protected])
@[email protected] @[email protected] Please note that before anyone blames #Reagan, that graph started to diverge and get shaky in the *early* 1970s. The apotheosis of #Keynes’ #economics was 1971’s #Nixon Shock; after that a brief reactionary blip into #Friedman’s #monetarism as the decade ended. We’ve been living with the worst of both worlds since the mid-80s as central planners try to ride herd on the #inflation of floating fiat currencies.


@DrRGST Source?
@DrRGST @DemocracyMattersALot Maddening, unless you’re a rich asshole, especially an orange rich asshole.
@DrRGST I wonder if there are any current economic transitions to which this chart might apply. Not sure ... I'll go ask ChatGPT to make me a list.
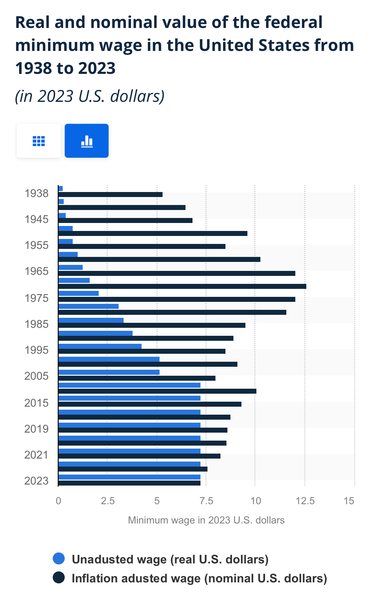
Look at the minimum wage inflation adjusted.
https://www.statista.com/statistics/1065466/real-nominal-value-minimum-wage-us/

@DrRGST I suspect this is US-only.
I wonder what the chart would look like for the UK, where we supposedly have a "productivity crisis". When did our productivity stop going up?
@DrRGST @gwadej Please note that before anyone blames #Reagan, that graph started to diverge and get shaky in the *early* 1970s. The apotheosis of #Keynes’ #economics was 1971’s #Nixon Shock; after that a brief reactionary blip into #Friedman’s #monetarism as the decade ended.
We’ve been living with the worst of both worlds since the mid-80s as central planners try to ride herd on the #inflation of floating fiat currencies.
@DrRGST
Does anyone have plots like this for European countries? Especially the ones not under communism.
Does anyone have plots like this for European countries? Especially the ones not under communism.
@DrRGST Thanks, Reagan!
@DrRGST Dokumentiert recht gut die Verteilung an das obere Prozent der Bevölkerung.