
Ever wanted to render Graphviz graphs in the browser with pure Python? Now you can 🐍🌐
Check out the WebAssembly-powered package gvrender! 👇 #Python #WASM #Graphviz
Check out the WebAssembly-powered package gvrender! 👇 #Python #WASM #Graphviz
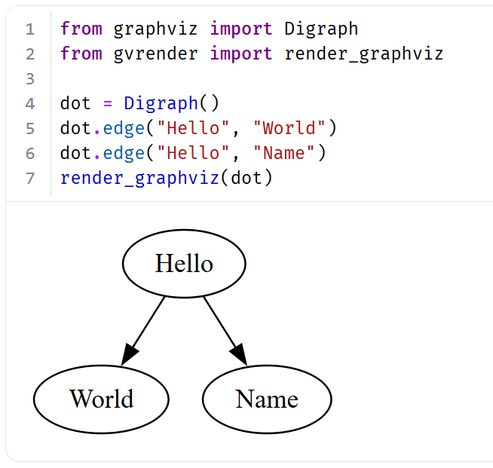
I recently more often view generated SVGs in #Emacs
- build system task dependency graph like https://codeberg.org/harald/pythonbuilder#dependency-graph-of-pythonbuilder-s-build
- class dependency graph for a TypeScript project generated from https://github.com/PSeitz/ts-dependency-graph
In both cases it would be great if clicking on a node would result in some emacs command being called.
Any ideas?
Silly question for the static webpage people here…
I want to put together a documentation webpage for a system that a few of us have developed. This isn't API documentation, but rather end-user documentation. Some of it will discuss deployment instructions, but there'll be a lot of diagrams and screenshots. I'll host a copy of it, but it will probably also get shipped with the application.
For source-code documentation, I quite like using Doxygen, since it can integrate well with `graphviz` and `mscgen`. `graphviz` is good for showing state transition diagrams, and `mscgen` is great for displaying how messages are passed between systems.
It's good being able to define the diagram *in the text* and have a diagram generated in its place. Makes things a lot easier to maintain.
Doxygen though doesn't work so well without source code. That's 99% of what it does, parse source code for docstrings and format them.
At work I had a similar situation, my employer had chosen to use Hugo, and I needed `graphviz`, the kludge taken there was to use client-side JavaScript to render the diagram. I'd like to avoid that here.
Is there a static website generator out there that can take a block of text in my markdown, and use `graphviz`/`mscgen` to place a diagram in its place?
Книга в Markdown: Автоматическая сборка статического сайта mdBook и файла DOCX с оформлением по ГОСТ
Текст книг, учебных пособий, научно-технических статей, документации, дипломных и курсовых работ часто набирается и редактируется в WYSIWYG-редакторе, таком как Microsoft Word, в том числе вследствие того, что издательства и организации требуют от авторов оформленный по ГОСТ или внутренним стандартам docx-документ. Процесс работы в Microsoft Word и аналогичных редакторах не лишён недостатков: docx-файлы трудно версионировать в git, а для объединения нескольких документов в один придётся перенумеровывать источники, рисунки, таблицы, формулы. Альтернативой docx является LaTeX. Однако работа со стилями в LaTeX простотой и минималистичным синтаксисом не отличается , причём издательства от использования формата docx отказываться не торопятся. А инструменты в духе typst отличаются нестандартным синтаксисом языка для описания документов, причём возможность генерации сайтов в typst имеет пометку «in preview». Markdown — популярный и удобный язык разметки, но это также и очень ограниченный формат. Поэтому задача написания в Markdown сложной технической документации по ГОСТ, научной статьи с автоматической настройкой оформления для заданного издательства или хорошо оформленного онлайн-учебника может показаться неосуществимой. В этой статье рассмотрим способ работы над научно-техническими статьями и книгами в формате Markdown на основе подхода Docs as Code с учётом строгих ограничений на оформление, используемый Петром Советовым @true-grue и мной при подготовке учебных материалов в РТУ МИРЭА. Способ заключается в применении утилиты pandoc для построения дерева абстрактного синтаксиса (AST) Markdown-документа с последующим переписыванием AST набором фильтров на Lua и трансляцией AST в форматы docx и pdf, соответствующие ГОСТ, а также в диалект markdown, совместимый с mdBook , для генерации онлайн-учебника в виде статического сайта. Исходный код книги , написанной с использованием описанного в статье подхода, опубликован на GitHub.
https://habr.com/ru/articles/987982/
#pandoc #markdown #lua #python #документирование #гост #docx #graphviz #mdbook #github

Текст книг, учебных пособий, научно-технических статей, документации, дипломных и курсовых работ часто набирается и редактируется в WYSIWYG-редакторе, таком как Microsoft Word, в том числе вследствие...
Having the freedom to chose my work environment on the computer, I move more and more tasks to Emacs recently, like running terminal windows with https://codeberg.org/harald/terminal-frame . Another pet of mine is my python build system: https://codeberg.org/harald/pythonbuilder
The latter can produce a nice SVG graph, using #graphviz, of the dependency tree of the build setup.
And should I forget which targets the build has, it is just a C-x C-f dependencies.svg away to see that graph.😀
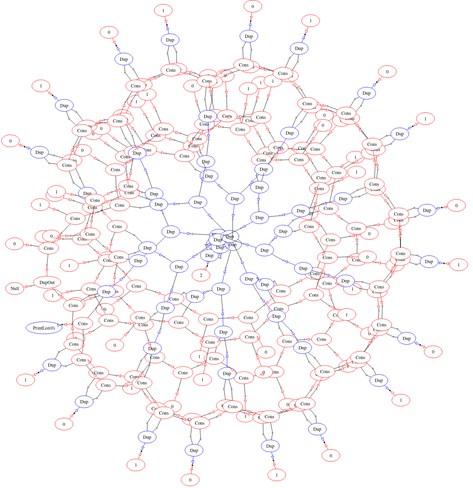
On day 11, both parts were quite simple: counting paths required a DFS with cache.
On part 2, the cache was different… unless one had an epiphany to solve it using part 1 because the input graph was a Direct-Acyclic-Graph: therefore ensuring one of fft->dac or dac->fft would have no paths; the solution would be paths(svr->fft)×paths(fft->dac)×paths(dac->out).
Yet I did not think of this, and that's despite using the first minutes actually plotting the input:


