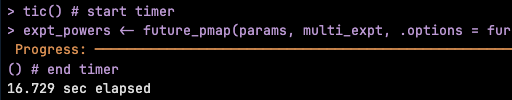
we ran a multi-decade extraction of points-in-time for 46000 points 1993-2024 (at bottom level, it's variable so we indexed the level upfront for each point) ran this the "traditional way" using #terra #GDAL to extract points from relevant layers (point-sets grouped by date,level) for salt,temp,u,v,w,mld - ran on 28cpus with #furrr/#future took ~80min

will get a public dataset to repeat the example for illustration (elephant seals I hope)

#rstats future_map in #furrr on #slurm has stopped being my friend ... multicore or multisession, both take way longer than normal - tested on small sets with 6 cores, smallish sets with 24, and the real job with 128 cores

parallel::parLapply works fine in the small or all 128 cores

any ideas?

Today's experiment in handling large #vcf files: I've extracted my DP values using bcftools and put them in a partitioned #parquet dataset. Currently using #furrr to process each chromosome individually, piping straight from the parquet into a new partitioned parquet file. I haven't done any proper benchmarking, but RAM use is very manageable so far, and runtimes seem acceptable. An upside is that crashes are potentially recoverable based on the written parquet files.
Just playing a bit with #Google #Bard (https://bard.google.com/) and, at least for basic coding stuff, it gives reasonable answers, here are examples of using the #Rstats #ggplot2 and #furrr libraries
β€ŽTry Bard, an AI experiment by Google

Bard is your creative and helpful collaborator to supercharge your imagination, boost productivity, and bring ideas to life.

it's a furrry kind of morning #furrr #rstats
I love the package furrr in R, but why can't I use it properly to generate ggplot graphs from a rstan object? Has anybody had the same problem? #rstats #furrr