 Hacker News
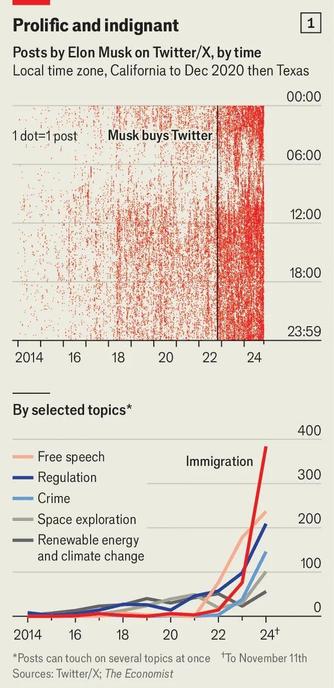
"A striking chart from our analysis of Elon Musk’s tweets over the years: ever more intense, darker, more political and more MAGA"
https://x.com/AntonLaGuardia/status/1859965038901285342
#DataViz #Data_Viz #USPol #Politics

Detailed walkthrough on loading particle data from the #yt_project in #inTRACKtive : https://youtu.be/7olNKbXDvf4?si=f0efDwGBiuyYM7XM
Or, just check out the detailed notebook on processing data to create an intermediate CSV that the inTRACKtive tools can port to the expected zarr format from this repo: https://github.com/data-exp-lab/inTRACKtive_yt_demo
#OpenSource #FOSS #tutorial #Python #yt
#DataVisualization #data_viz #3d #3dviz #3dvis
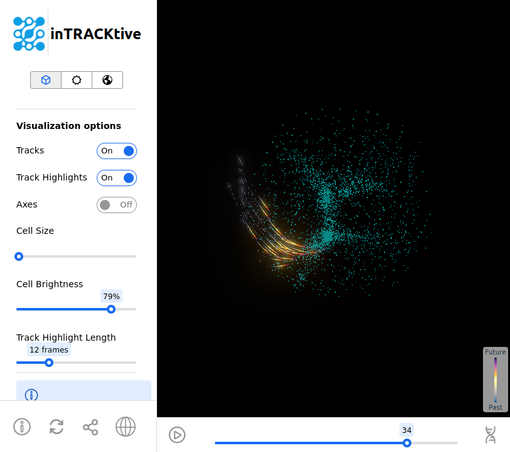

Detailed Walkthrough: Particle data from yt in inTRACKtive
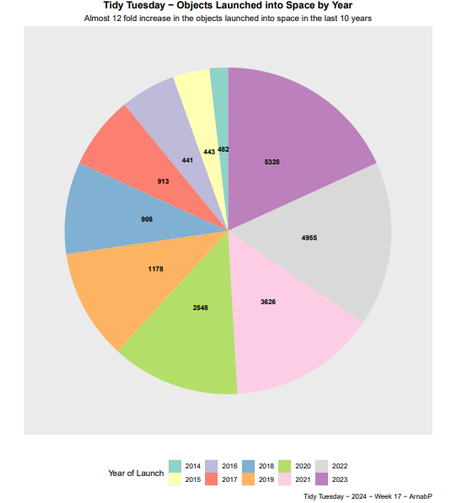
#TidyTuesday Week 17 - Objects Launched into space - A Pie Chart showing a big increase in the objects launched into space during the last decade. #Rstats #DataScience #data_viz
Code at the link :- https://github.com/arnabpanja/MyRepoR/tree/main/tidy_tuesday/2024/week17

Love seeing more git-like collaborative reviews come to the BI layer. One challenge is that BI is visual, and another is that the group of reviewers should include non-technical folks like business stakeholders.
I’ve never used Hex but this looks slick: https://hex.tech/blog/reviews/

Stoked about recent progress on yt_xarray's embedded transformation framework! This new feature takes a non-cartesian #xarray dataset and wraps it in a cartesian #yt dataset. As yt needs data, it will interpolate data on demand. This let's you use yt's volume rendering without saving off interpolated versions of datasets (which is how I used to do things...). Makes it **much** easier to generate volume renderings of geophysical fields with yt.
#python #data_viz #3d
#python #data_viz #3d

After answering a question earlier this week on adding streamlines to volume renderings in yt, decided to write up my first blog post in a while :)
https://chrishavlin.github.io/post/yt-vr-w-streamlines/
#yt #yt-project #yt_astro #data_viz #visualization #3D #python #open_source


Working on some content for an upcoming yt-napari video tutorial and I can't resist uploading a teaser... A big part of the current yt-napari work has been connecting to other napari plugins. Here's a demo showing napari-plot-profile in action with data from yt-napari: https://youtu.be/UgNaqbtNJh0

using napari-plot-profile with yt-napari
What a yarn! Journalists are turning to crochet to tell data stories #2023_08_09 #nieman_lab #sarah_scire #featured_art #regular_post #alyssa_fowers #andrew_hahn #crochet #data_visualization #data_viz
