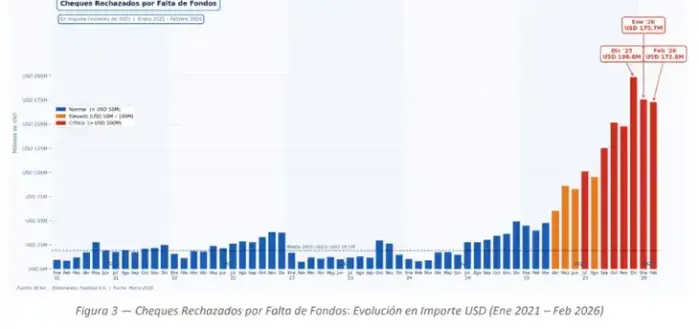
T-Map will celebrate the March 1st Independence Movement anniversary by letting you change your map navigation car icon to what appears to be activist 유관순 (Yu Gwan-sun) driving a convertible. #3-1운동 #유관순 #티맵 #태극기 #🇰🇷 #삼일절 #TMap
Via: https://blog.naver.com/tmapmobility/224196887314?fromRss=true&trackingCode=rss

What can you do with some upside down Catalunya polygon and some meteorological data?
Obviously, a Christmas tree GIFt!!
I present you 25 years of monthly precipitation values in a festive mood:

#rstats #tmap #meteospain #rspatial #gif

tmap or ggplot2 for maps? 🗺️

David O’Sullivan breaks down the trade-offs in a blog post.

URL: https://dosull.github.io/posts/2024-11-16-tmap-vs-ggplot/tmap4-vs-ggplot2.html

#RStats #RSpatial #Maps #tmap #ggplot2

tmap vs. ggplot2 for mapping – Geospatial Stuff

For me at least the choice between ggplot2 and tmap is an ongoing question. Here are my latest thoughts on the subject (with code).

Geospatial Stuff
*SOLVED* Any #RSpatial / #tmap folks know how to do linebreaks in legend titles in 'View' mode in {tmap} v4.2 and care to help a fella out? I'm probably missing something obvious but equivalent methods I used to use in v3 aren't working for me... (reprex in alt text)
Day 05 of #30DayMapChallenge on Earth (Classical Elements 1/4) I've discovered and used the new `tmap.mapgl` to show Swizerland's elevation. It's mindblowing how easy it is. guillaume-noblet.com/30DayMapChal... #dataviz #rstats #tmap #gis #mapgl cc @mtennekes and thanks!
#30DayMapChallenge Day 3: Polygons
I've tried to order the municipalities and color them according to their area. However, I'm not very happy because I couldn't fix the scale inside the facets and keep the features centered at the same time.
#rstats #tmap #opendata #GISChat
#30DayMapChallenge - Lines
Rivers of the Canton of Aargau, mapped using #rstats.
Data: Bachkataster, Canton of Aargau
#tmap #opendata #GIS #river #Cartography
#30DayMapChallenge - Points
A map with the Emergency Meeting Points in Switzerland, colored according to their elevation.
#opendata #R #ggplot #tmap

🗺️ New blog post: introducing Spatial Data Visualization with tmap, a work-in-progress guide to thematic mapping in #RStats.

Learn about the book, its progress, and how to contribute: https://geocompx.org/post/2025/tmap-bp1/

#DataViz #Mapping #tmap #geocompx

tmap.mapgl introduces two new modes for the R tmap package: mapbox and maplibre 🌍🗺️

Still in development—requires dev versions of tmap and tmap.mapgl.

More info: https://github.com/r-tmap/tmap.mapgl

#rstats #rspatial #tmap

GitHub - r-tmap/tmap.mapgl: tmap extension featuring two new modes: 'mapbox' and 'maplibre'

tmap extension featuring two new modes: 'mapbox' and 'maplibre' - GitHub - r-tmap/tmap.mapgl: tmap extension featuring two new modes: 'mapbox' and 'maplibre'

GitHub