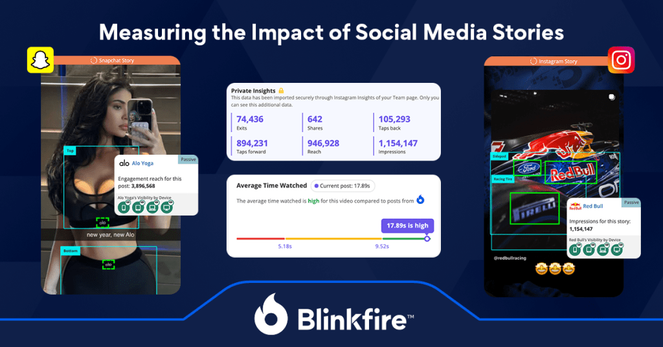
Measuring the Impact of Social Media Stories
Stories have become a powerhouse for real-time engagement and authentic brand storytelling. Unlike permanent social media feed posts, Stories offer a “behind-the-scenes” feel that fans crave, making them an essential asset for sponsorship activations.
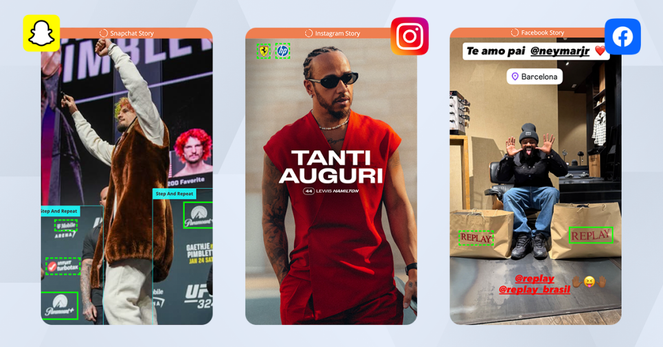
However, because Stories are temporary, tracking their true impact often feels like chasing a ghost. Blinkfire solves this by connecting to your channels to pull in Private Insights. This is the high-level data typically hidden behind platform logins that gives users a detailed view of performance across Instagram, Facebook, and Snapchat stories. In addition, you get all the brand, asset, and scene spotting that comes with Blinkfire’s patented AI and computer-vision technology.
Instagram & Facebook Stories
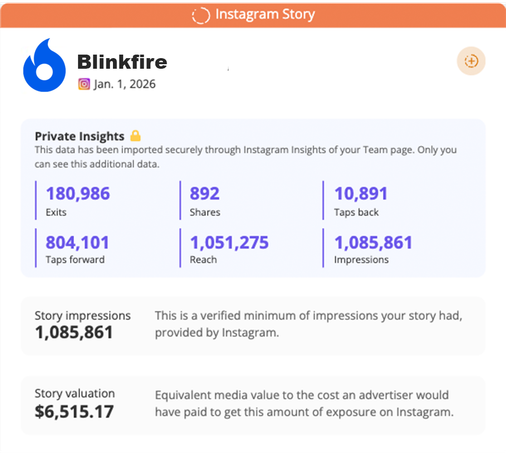
For these Meta platforms, Blinkfire moves beyond public impressions to provide a detailed map of metrics that help you identify how users interact with your content. By connecting your official accounts, you can unlock private metrics such as:
- Impressions: See the total number of times your story was seen.
- Reach: Measures the total number of unique users who viewed your story.
- Taps Forward/Back: Measure interest by tracking how many fans skipped ahead or looped back to re-watch a specific frame.
- Exits: Identify exactly where you lost your audience’s attention.
- Shares: See what content resonated with your fans enough to share with their friends.
Snapchat: Engaging Gen-Z With Stories
Snapchat has strategically engineered its platform to cater to the rapid-fire, story-first content that aligns perfectly with the shorter attention spans of today’s mobile consumers. Snapchat is often a “missing piece” in sponsorship reporting, but Blinkfire makes it easier than ever to track this growing social channel.
- Impressions & Reach: A clear breakdown of every story view and unique fans reached.
- Replies & Shares: Track active engagement and the “fan-powered” amplification of your content.
- Taps Forward/Back: Measure interest by tracking how many fans skipped ahead or looped back to re-watch a specific frame.
- Total & Average Time Watched: Discover how long your content actually held their interest. This shows the difference between a quick “scroll-by” and a fan who is truly captivated by your story. You can also compare posts to other content to gauge below-average, typical, and above-average.
- Likes: A clear sign of fan approval. This metric counts the number of times people went out of their way to show they enjoyed your content.
How to Use and Sell Story Content
Having these verified, real-time metrics allows rights holders and brands to reference data-backed strategies when it comes to content creation and partnership sales.
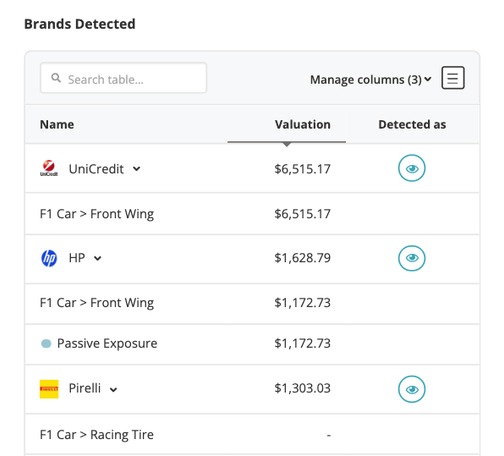
- Transparent Reporting on Story Value: By calculating the equivalent media value of your stories, Blinkfire shows you exactly how much your Snapchat content is worth, giving exportable professional, automated summaries of every branded activation.
- Prove Your Worth: Use historical data to defend your rate cards during renewals by showing a year-over-year increase in story engagement.
- Identify “White Space”: If your unbranded stories are driving massive reach, you’ve found the perfect spot to integrate a new partner.
Track and Value Your Story Content with Blinkfire
With Blinkfire’s all-in-one reporting tools, you can track exposure in real time across social media stories, digital channels, Advanced TV, and broadcasts. Ready to understand what’s driving real value? Let’s talk about how Blinkfire can help you tell smarter stories and build stronger partnerships.
Demo Blinkfire
#blinkfire #brand #brandedContent #facebook #Instagram #socialMedia #Sponsorships #Stories