You saw or you made something awesome related to Quarto either with #ObservableJS, #RStats, #Python or #JuliaLang?
You want it to be seen/shared?
Please submit a suggestion issue to #AwesomeQuarto
PS: if you like this list, star it and share it 😉
You saw or you made something awesome related to Quarto either with #ObservableJS, #RStats, #Python or #JuliaLang?
You want it to be seen/shared?
Please submit a suggestion issue to #AwesomeQuarto
PS: if you like this list, star it and share it 😉
You saw or you made something related to #QuartoPub #Quarto either with #ObservableJS, #RStats, #Python or #JuliaLang?
You want it to be seen/shared?
Please submit a suggestion issue to #AwesomeQuarto
PS: if you like this list, star it and share it 😉
https://github.com/mcanouil/awesome-quarto?tab=readme-ov-file
Another #Quarto + #RStats + Observable combination for Day 27 of the #30DayChartChallenge📊
Two heatmaps to illustrate the prompt of "Noise" - unsorted heatmaps look like random noise, (sensibly) sorted heatmaps are more likely to reveal patterns!
#30DayChartChallenge Day3 – Circular. Total cat and dog rescues by the London fire brigade. 📊🐈🐶🚒
Cats get lost in summer, dogs need help all year round (although far less).
Sticking with the same little data set to test out #ObservableJS Plot and #Python in #Quarto. If you want to make interactive charts and used to python, this is a great option. Full code: https://lnkd.in/ee9juNJq
Nicole Rennie wrote a great blog on Observable for R users, so I finally gave it a go https://nrennie.rbind.io/blog/observable-r-users/
@cpbotha #marimo looks pretty damn cool! Thanks for that nudge in the DHV. I've recently been using #quarto (quarto.org) since I wanted something that played well with Git and is easier to edit with my #vim muscle memory. Quarto is geared towards authoring high-quality documents, however, and a bit cumbersome for data exploration. It does support #ObservableJS, but I was hoping for something similar in #Python.
Definitely going to play around with Marimo some more! It looks like an awesome way to explore and document projects with a strong data science or signal processing component.
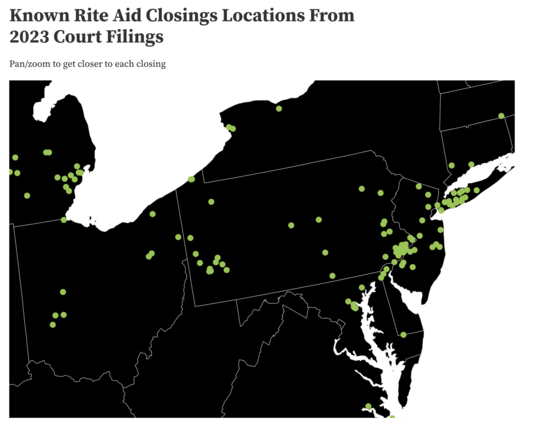
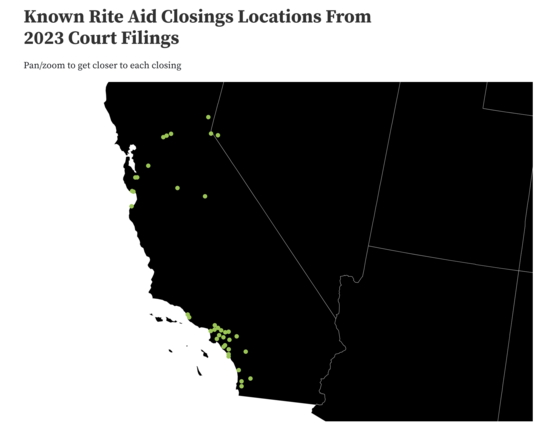
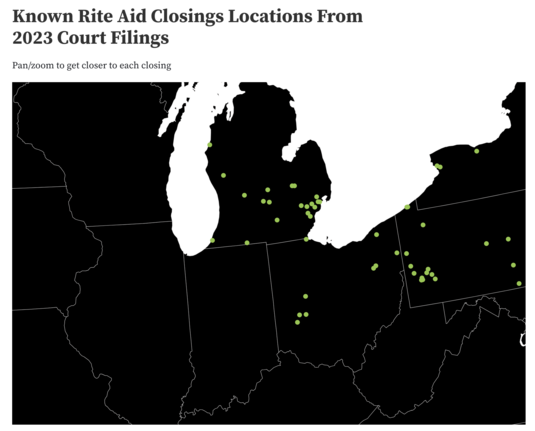
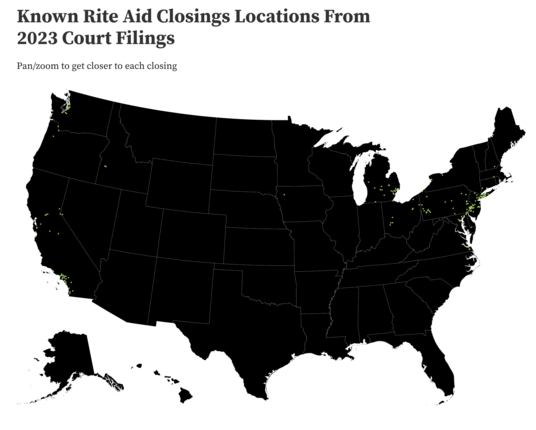
Rite Aid has to file papers with the bankruptcy court for each round of actual closings (two such filings, so far, in 2023).
NJ, NY, MI, CA hit hardest so far.
Shld be able to start mapping possible pharmacy deserts, soon.
Pan/zoom the #ObservableJS Plot: https://observablehq.com/@hrbrmstr/known-rite-aid-closings-locations-from-2023-court-filings
New #RStats #WebR #ObservableJS notebook up that is a more practical (vs. toy) example.
I used to — in a cron job — run a simple glm() on our tag data to get an idea when we’d reach `n` tags.
WebR makes it possible to do that directly in Observable notebooks.
Also includes a neat way to enter R code in Observable Markdown cells and eval it from those cells (so you get syntax highlighting).
https://observablehq.com/@hrbrmstr/webr-glm-in-observable#rPredict
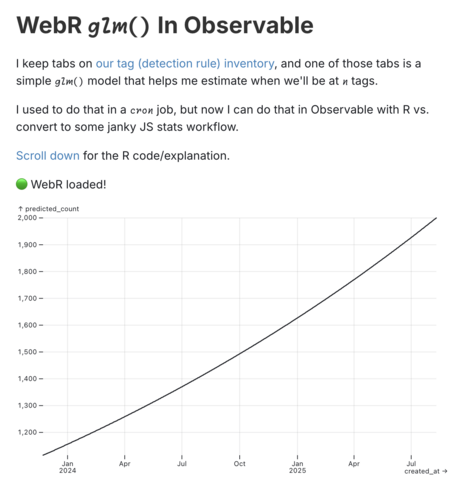

I keep tabs on our tag (detection rule) inventory, and one of those tabs is a simple `glm()` model that helps me estimate when we'll be at `n` tags. I used to do that in a `cron` job, but now I can do that in Observable with R vs. convert to some janky JS stats workflow. Scroll down for the R code/explanation. We can put the R code into a Markdown code block so we get syntax highlighting and somewhat less-janky editing. The cell above this one just grabs the inner text of the block to do the eval. I'm just
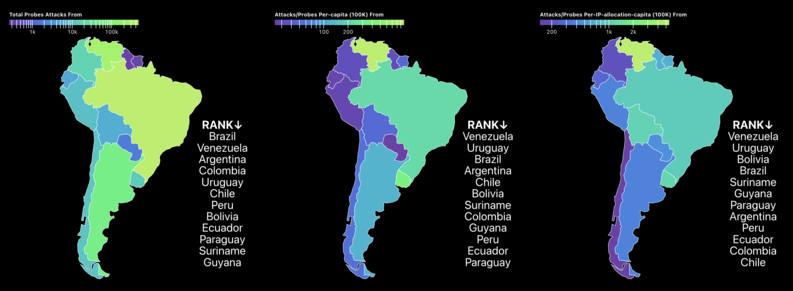
Used some #RStats to wrangle data into a GeoJSON + #ObservableJS for plotting today's Day 12: South America entry to the #30DayMapChallenge.
https://30dmc.hrbrmstr.dev/2023/day-12.html has the deets, but thechoroplethss show raw and normalized cyber attack volume coming from these eleven sources.