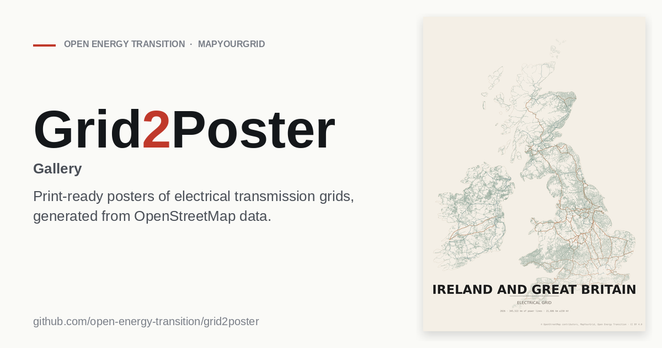
Des posters mondiaux des réseaux électriques mappés dans #openstreetmap ?
* Estatísticas do OSM *
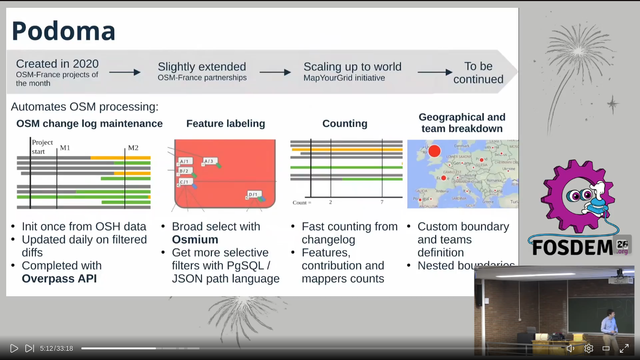
@flacombe anuncia uma nova versão do #Podoma, uma solução livre para contribuições ao #openstreetmap
A ferramenta é útil tanto para os #projetosdamesa da comunidade @osm_fr quanto para projetos de longo prazo em escala nacional ou global, como #Gespot ou #mapyourgrid
https://www.linkedin.com/posts/lacombef_podoma-openstreetmap-mapyourgrid-ugcPost-7452967052446949376-iKxt/

* OSM Statistics *
@flacombe announces a new version of #Podoma, a free solution for #OpenStreetMap contributions
The tool is useful for both the @osm_fr community’s #projectofthemonth and long-term national or global projects such as #Gespot or #mapyourgrid
https://www.linkedin.com/posts/lacombef_podoma-openstreetmap-mapyourgrid-ugcPost-7452967052446949376-iKxt/
* OSM statistiques *
@flacombe annonce une nouvelle version de #Podoma solution libre des contributions #openstreetmap
L’outil sert aussi bien aux #projetdumois de la communauté @osm_fr que des projets de long terme échelle nationale ou mondiale comme #Gespot ou #mapyourgrid
https://www.linkedin.com/posts/lacombef_podoma-openstreetmap-mapyourgrid-ugcPost-7452967052446949376-iKxt/

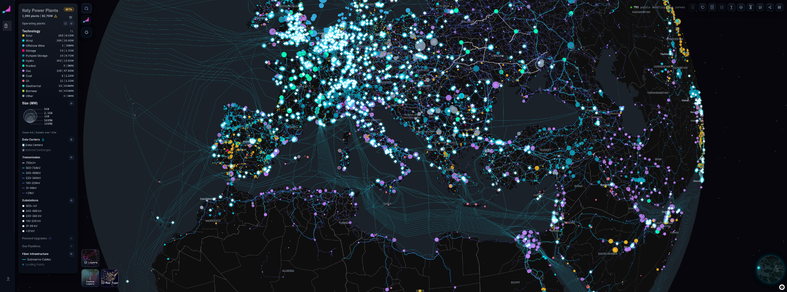
visualisez les données du réseau électrique mondial grâce à la communauté #openstreetmap , tout le monde peut l'améliorer!
#mapYourGrid #openGridWorks #energy #electricity #réseau #network #world #climateChange #sortirDesFossiles
Webinar: Power grids data quality - the impact on Energy System Planning
https://www.youtube.com/watch?v=KJ7V36CJ_JE
Check out: mapyourgrid.org #OpenStreetMap #MapYourGrid #PyPSA-Earth #powermodelling #powergrids #energytransition #gridinspector #podoma #osmose #powerplantm...
Free Webinar: The #MapYourGrid team is bringing together contributors from OpenStreetMap and power-system modeling experts from PyPSA-Earth to explore how better data can improve real-world energy planning.
🗓️ Thursday, 8 January at 17:00-18:00 CET
📍 Online
🔗 Sign up: https://www.eventbrite.com/e/data-quality-the-impact-on-energy-system-planning-tickets-1977704315847

the project #mapYourGrid has 7.3 million km of lines mapped in #openstreetmap thanks to professionals and all other contributors.
Andreas Hernandez DenyerAndreas Hernandez Denyer, Energy systems modeller | Founder of Climate Club:
The world’s first open and free database which tracks the high-voltage line length of almost every country’s grid is finished, which shows a significant underestimation of global line lengths.❗
MapYourGrid and Open Energy Transition developed a bottom-up approach by going through reports, datasets, geospatial files, and websites of every country’s transmission system operator (TSO), electricity regulator, ministry of energy or other sources.
Why?
➡️ 1. Data such as these are locked behind large paywalls, which means that the “6 million kilometres” of global transmission grid stated in the IEA’s 2025 World Energy Outlook cannot be easily verified or understood. Furthermore, our approach allows for people to add to the open database, comment if there are mistakes, update the data, and validate it since all sources are indicated. Open data and Open Source allows for stringent validation, and can guarantee higher levels of quality.
➡️ 2. We wanted to know how much of the grid is mapped in OpenStreetMap, globally, per country and per voltage level. Being able to compare this with official data, now allows the community and MapYourGrid to see the coverage missing (or not!) in detail, and to attribute a quality score to a country’s grid.
So, in total this gives us a high-voltage grid estimate of at least 7.3 million circuit kilometres. Thus, we now estimate that around 75% of the world’s high-voltage grid is mapped in OpenStreetMap (rough estimate).
Find our Global Transmission Length Index spreadsheet here on our website:
https://mapyourgrid.org/global-grid-data/#__tabbed_1_5
Learn more about the scope, methodology and the details in our blog, and in the database itself:
https://mapyourgrid.org/blog/20251128-LineLength/
As I once said, Turkmenistan is the enemy of “control+f= ‘km’”.
#opendata #opensource #energy #transition #tht #electricity #crodsourcing #global
Occupation détente de soir d'hiver : tracer des lignes électriques dans #OpenStreetMap avec une tisane bien chaude et une bonne musique #MapYourGrid
Retours du State of the Map Europe 2025 | Adrien Pavie
https://pavie.info/blog/retour-sotm-europe-2025/
Les 14 et 15 novembre 2025, le State of the Map Europe s’est tenu à Dundee, en pleine Écosse. L’évènement regroupe la communauté #OpenStreetMap Européenne sur 2 jours pour partager les nouveautés logicielles, les initiatives cartographiques, et adresser de nouveaux défis. J’ai eu la chance d’y participer : voici mes coups de cœur, découvertes, et les tendances qui vont marquer l’écosystème OSM dans les mois à venir.
#sotm #sotmeu #mapyourgrid #panoramax #clearance #heigit #sig #opendata

Retours du State of the Map Europe 2025
Les 14 et 15 novembre 2025, le State of the Map Europe s’est tenu à Dundee, en pleine Écosse. L’évènement regroupe la communauté OpenStreetMap Européenne sur 2 jours pour partager les nouveautés logicielles, les initiatives cartographiques, et adresser de nouveaux défis. J’ai eu la chance d’y participer : voici mes coups de cœur, découvertes, et les tendances qui vont marquer l’écosystème OSM dans les mois à venir.