#2 So the movie above shows the °C teleconnection from any pixel on land to the Early Warning zones in the Atlantic.
A pixel got plotted if its seasonal temperature difference year-on-year matched >5 times per decade and that in at least 3 decades. The colour scale denotes the strength of the season's teleconnection.
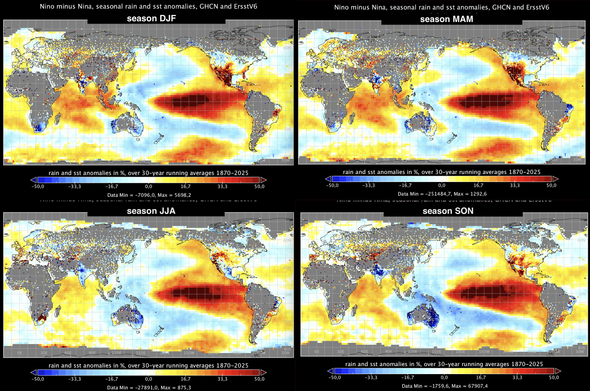
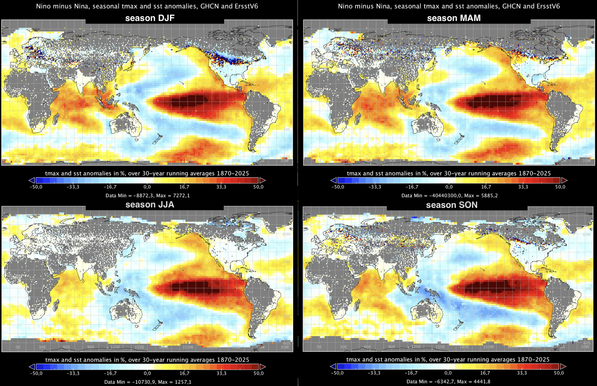
The seasonal sea surface temperature I compared the land pixels to is from Era5 and from ErsstV6. The movie shows both comparisons merged.
Teleconnections can be immediate – as shown in the Berkeley movie. But they can also exist years and years removed. Like the Tasmanian corals in the paper in #1 which dictate AMOC strength from 46 years in the past!
I didn't go that far back ^^
But I did also compare for example the season JJA of the zones with every pixel's 4 last and 4 next seasons.
Why I did that: it bugged me that Asia only had very few pixel matches if I confine the comparison to same_season.
I couldn't believe that Siberia really had no teleconnection to one of the AMOC zones at all.
So I looked at the 8 Early Warning zones
with their teleconnected pixels on land, iterated from 4 seasons back to 4 seasons into the future.
The same "bingo" criteria applied.
And Asia lit up!
The data in this movie is not Berkeley but weather stations in #NOAA's global station network #GHCN.
These station data series had to first meet quality criteria before they entered the comparison.
This results in far fewer pixels than Berkeley would have produced in this "4x4 season" perspective.
It's rather boring to watch.
Altho not boring if you actually want to use the pixels to then search for temperature proxies for the AMOC!
To make it less boring, the audio track here is from #JesusChristSuperstar . The incredible Ian Gillan of #DeepPurple sings Jesus' prayer in the Garden of Gethsemane.
"Take this cup away from me for I don't want to taste its poison",
very apt, don't you agree, with Easter, #climateChange , AMOC collapse and all?
Want more? There's another 😁