Happy to share our invited article “Komplexe Tabellen verständlich machen” just published in BIOspektrum: https://doi.org/10.1007/s12268-025-2553-2 about our tool #datavzrd @johanneskoester
⚠️ Disclaimer: The article is in German.
Happy to share our invited article “Komplexe Tabellen verständlich machen” just published in BIOspektrum: https://doi.org/10.1007/s12268-025-2553-2 about our tool #datavzrd @johanneskoester
⚠️ Disclaimer: The article is in German.
New open-source tool makes complex data understandable
Y'all heard about this?
New dopamine source potentially unlocked.
Create interactive HTML-based reports fed by CSVs, TSVs, or JSON data with the format described using YAML instead of using an exported CSV to Alteryx to MS SQL to Power BI pipeline? Yes, please.
We thought moving to using Python and APIs to skip the "CSV to Alteryx" step was increasing efficiency (and decreasing software license costs). I think this would be even better. Too bad we would have to learn a new tool and don't have time.

Tabular data is at the heart of scientific analysis—whether in medicine, the social sciences, or even archaeology. Making it comprehensible and usable is often a tedious task, especially when the data is extensive or complex. The Institute for Artificial Intelligence in Medicine (IKIM) at the University of Duisburg-Essen has developed an elegant solution: Datavzrd.
Excited to share that our preprint, Datavzrd: Rapid programming- and maintenance-free interactive visualization and communication of tabular data, is now up on bioRxiv! 🎉 #datavzrd

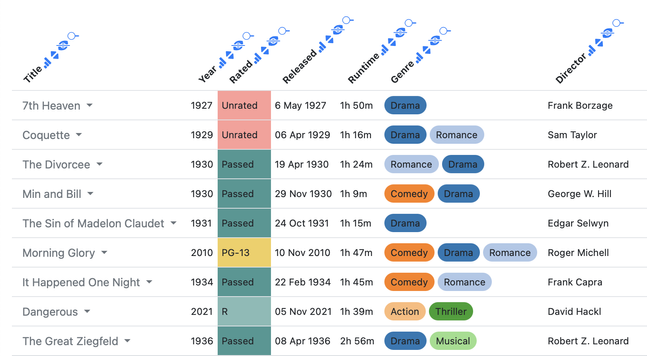
Tabular data, often scattered across multiple tables, is the primary output of data analyses in virtually all scientific fields. Exchange and communication of tabular data is therefore a central challenge. We present Datavzrd, a tool for creating portable, visually rich, interactive reports from tabular data in any kind of scientific discipline. Datavzrd unifies the strengths of currently common generic approaches for interactive visualization like R Shiny with the portability, ease of use and sustainability of plain spreadsheets. The generated reports do not require the maintenance of a web server nor the installation of specialized software for viewing and can simply be attached to emails, shared via cloud services, or serve as manuscript supplements. They can be specified without requiring imperative programming, thereby enabling rapid development and offering accessibility for non-computational scientists, unlocking the look and feel of dedicated manually crafted web applications without the maintenance and development burden. Datavzrd reports scale from small tables to thousands or millions of rows and offer the ability to link multiple related tables, allowing to jump between corresponding rows or hierarchically explore growing levels of detail. ### Competing Interest Statement The authors have declared no competing interest.
I am thrilled to see #Datavzrd being used to get portable interactive visual output tables in #srahunter: https://www.biorxiv.org/content/10.1101/2024.03.19.585745v2


 :EA DATA. SF: