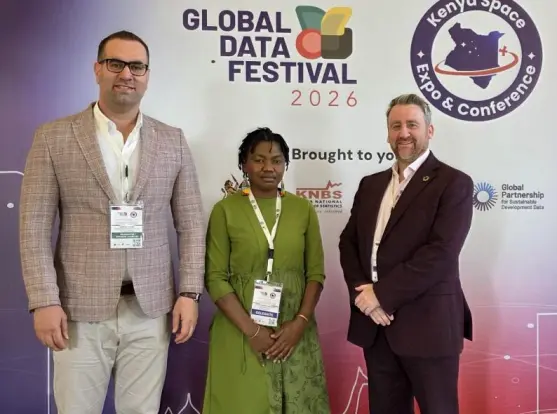
How can countries make better decisions when census data is incomplete or outdated?

At the 2026 Global Data Festival in Nairobi, WorldPop showcased how AI, geospatial mapping and population intelligence are helping governments improve census operations, vaccination planning, climate resilience and official statistics.

👉 https://www.worldpop.org/blog/worldpop-experts-pioneer-the-future-of-population-intelligence-at-2026-global-data-festival/

#AI #GIS #DataScience #Demography #PopulationData #PublicHealth #ClimateData #GDF2026 #GDFKSEC2026 #GlobalDatafest2026

WorldPop Experts Pioneer the Future of Population Intelligence at 2026 Global Data Festival

WorldPop showcased AI, geospatial mapping and population intelligence at the 2026 Global Data Festival, helping countries modernise census and data systems.

WorldPop

RE: https://fediscience.org/@rahmstorf/116742444870233764

Vanishing Research Data

Announced early in 2025

Utterly foreseeable

The reason why and what to expect next : https://www.project2025.observer

All research institutions have an urgent need of a strong and resilient Data Policy (not only in climate science).

(Oh yes, and a Software Policy too)

#ResearchData
#ResearchSoftware
#DataPolicy
#SoftwarePolicy
#ClimateChange
#ClimateData

While research documents behavioral adaptations to heat, we lack systematic, empirical understanding of how these adaptations change daily urban mobility patterns. Here, we combine location-based digital trace mobility data from mobile phones with high-resolution #climatedata, to provide evidence that heat not only reduces activity and restructures mobility, but that it exerts variable pressures on different groups, creating #vulnerabilities and potentially amplifying #socialinequalities

RE: https://mas.to/@CRANberriesFeed/116606326823968998

We'll try for a third time. This has been archived 2X already. This time I just removed all caching capability and basically rewrote the whole package for a major release that breaks backward capability but simplifies using it. Now it only has two single functions, one creates a data.table the other a {terra} SpatRaster of the CRU CL 2.0 climate data either by download or from local files.
https://docs.ropensci.org/getCRUCLdata/

#RStats #ClimateData

Because I'm a glutton for punishment, I'm resurrecting (trying for a third time) {getCRUCLdata}. I'm not even sure that anyone uses it, but since I still have it sitting around, I've overhauled it and rewritten it to remove any caching, using {rappdirs} got me in trouble the first time, using R's own user cache directory got me in trouble the second time. So twice archived, now going back with no caching aside from in-session via {httr2}. https://codeberg.org/ropensci/getCRUCLdata #RStats #ClimateData
getCRUCLdata

CRU CL v. 2.0 Climatology Client for R

Codeberg.org

🌳📈 For all those at the intersection of #AI and #climatedata – join us at the next #AILearningLabs conversation.

We will explore approaches to building a responsible climate chatbot with experts and practitioners.

🗓️ May 18
🕛 12:00 UTC
✍️ Register: https://blog.okfn.org/ai-learning-labs-climate-registration-form/

In 2025, all European glacier regions saw a net mass loss, with Iceland recording its 2nd‑largest loss since 1976. It was the 4th year in a row that all 19 global glacier regions lost mass. Get more insight in the #ESOTC2025 from #Copernicus Climate @ECMWF and WMO https://climate.copernicus.eu/esotc/2025/glaciers?utm_source=socialmedia&utm_medium=MA&utm_campaign=european-state-of-the-climate-2025&utm_id=ESOTC-2025

#ClimateData

Explore the #ESOTC2025 key events map, showing major climate and weather events across Europe. From heatwaves, wildfires & droughts to cold waves, heavy rain, flooding & more, the map highlights where major events unfolded across the continent in 2025.

Go to the map 👉 https://climate.copernicus.eu/esotc/2025/key-events?utm_source=socialmedia&utm_medium=MA&utm_campaign=european-state-of-the-climate-2025&utm_id=ESOTC-2025

@ECMWF

#CopernicusClimate #ClimateData

European State of the Climate 2025 | Copernicus

Day 76. Land Surface Temperature 🌡️

This build uses monthly land-surface-temperature textures and blends them so the yearly cycle flows smoothly. The UI stays simple, month label plus click-to-pause playback, while Three.js/WebGL and custom shaders keep the scene map-like and readable.

🔗 https://maptheclouds.com/playground/30-day-map-challenge-2023/land-temp/

#100DayMapChallenge Day 76/100
#ThreeJS #WebGL #GLSL #ClimateData #Geospatial #Animation