Montreal launches its own bike counter after cancelling contract
The City of Montreal has launched its own open-data platform to track cyclist traffic across the city, weeks after cancelling a contract with the third-party company that previously managed the data.
https://www.cbc.ca/news/canada/montreal/montreal-bike-counter-9.7216381?cmp=rss

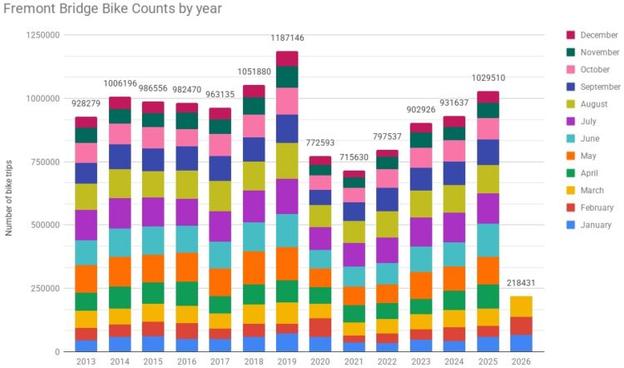
For the first time since the pandemic, Fremont Bridge bike trips topped 1 million in 2025 and are on pace for a new record – UPDATED

People took more than one million bike and scooter trips across the Fremont Bridge in 2025, the first calendar year to top the million mark since the COVID pandemic. But perhaps even more interesting is that 2026 is off the best start ever, recording more trips in January through March than any other year including the outlier high water mark set in 2019.

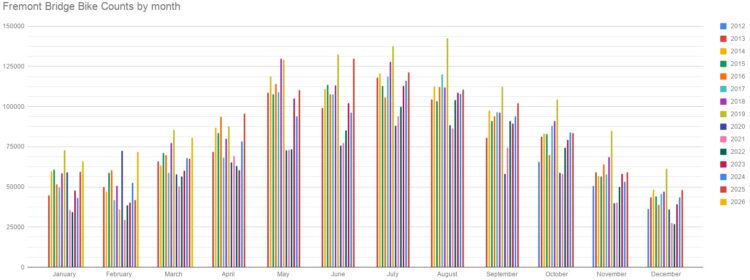
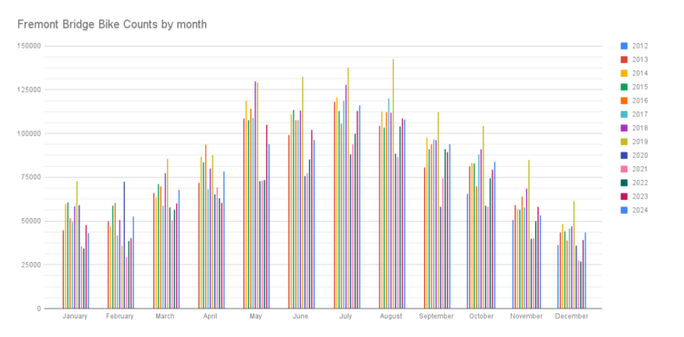
UPDATE 5/1: The April total is in, and it is an April record by a mile. 103,266 trips is 8% higher than the previous April record set last year. As shown in the monthly chart below, records of such magnitude have not happened since 2019, when riders smashed a series of monthly records late in the year, an exciting trend that continued into 2020 before is was wiped out by the pandemic. The big question now is whether riders have just gotten an earlier start this year or if the counts during the bike-loving summer months will rise proportionally. Even if we had an entire year of only winter and early spring, we would still be nearly on pace for one million bike and scooter trips over the Fremont Bridge. So much for Seattle being too rainy to ride a bike.

The Fremont Bridge is a key pinch point for several cross-city bike routes, which is why it is probably the city’s best location for sampling biking trends. There are few other places in the city where riders are funneled across a single counting point. However, the bridge’s role as a pinch point for trips heading to the center city also makes the counts highly reliant on downtown commutes. Return to office requirements from several major employers initially led to widely-reported traffic crunches, and now we are seeing that a whole lot of workers have decided to bike instead.

In fact, as the Seattle Times reported this week, Strava released a report that put the Westlake bikeway in the top three segments in the entire US with other two being in New York City, a metro area with five times the population. Sure, Strava use is going to skew toward populations that want to use tech to track their commutes, but this result is remarkable nonetheless. The Westlake bikeway opened less than ten years ago after a protracted and sometimes ugly fight including a lawsuit by the superyacht marina Nautical Landing. But thanks to tireless organizing and consistent political leadership across multiple mayors and city council transportation chairs, the project moved forward. It could easily have been stopped if one party got a lawsuit to stick or if one politician got cold feet in the face of very wealthy opposition. Now it is by at least one measure a top-three bike route in the entire country.

The 2025 and 2026 bike counts aren’t just rebuilding what we had. In 2019 when most Fremont bike count records were set, office buildings were packed with people commuting 5 days per week. Today, downtown office vacancy is still very high, hitting 34.7% by the end of 2025. Many employers have either abandoned their office space or only require a few days in-office per week. So the fact that these bike counts are nearly back to their pre-pandemic highs suggests there is something more happening than just work trips.

The number of Lime trips, for example, continue to reach levels few imagined back in 2019. Surely some Lime trips are commutes, but shared bikes are much more adept at handling little hops, side trips and transit connections rather than long repeat commutes. People making regular A to B to A commutes are much better served by owning their own bike or scooter. I would argue that Lime is showing one way that biking and scootering has become a normal part of everyday transportation in our city, enabling the spontaneity that cities are so good as providing.

Having a connected waterfront bikeway is also completely redrawing the map for bicycling around the city, providing an access point into downtown that is comfortable and inviting for big new portions of the city’s population. I think the next couple months are going to show us the true power of this new connection, especially now that the Yesler Way bikeway is finally complete. When the revamped Myrtle Edwards and Centennial Parks open, scheduled to happen by June, the whole waterfront will be connected to and through the downtown core and as far south as South Park and as far west as Alki and as far North as the Fremont Bridge, the Burke-Gilman Trail and beyond. Seattle has never had this level of bike connectivity before. Last summer, my then-7-year-old biked from Wallingford/U District to a Sounders game and back. I need you all to understand how unimaginable this was even just a decade ago.

This level of connectivity is only making the need to a safe Rainier Avenue more stark. Rainier Valley neighborhoods remain cut off from their only flat and direct connection to the downtown bike network. Beacon Hill is connected, the CD and Capitol Hill are connected, Magnolia is connected, Fremont and most of North Seattle are connected, Georgetown and SoDo are connected, even much of West Seattle is connected, yet Rainier Valley residents are still forced to choose between very steep hills or very unsafe roads. Especially with Judkins Park Station now creating a major reason for folks to want to bike on Rainier Ave, the status quo is untenable.

Given the great start to 2026 counts on the Fremont Bridge, I am ready to stop looking back to 2019 and instead consider 2025 as our new baseline. It represents Seattle’s new travel patterns after years of being scrambled by pandemic shutdowns and the subsequent reshaping of workforce trends. I will celebrate when we finally top 2019 because of the symbolic victory of setting a new record, but we are building back something even stronger with a higher ceiling. In fact, we have not yet reached our true bike riding tipping point, the point where it breaks fully into the mainstream and the average person considers biking as one of their everyday options. But our path to get there may be coming into view.

#SEAbikes #Seattle

Friday night just past 11 p.m., I was at first pleasantly surprised to see the #NYC Manhattan Br #BikeCounter reported > 6000 users today, which I hadn't seen previously this year. But then saw the annual total. WTF? I swear I passed by here in late August and estimated that it would be around Sep 15 before the counter reached 1 million. And yet the current total suggests that, no, that happened a week ago.

#NYCBike #BikeNYC people, please clue me in if you have been monitoring the counter.

@agnes @ascentale @bikenite #BikeNite A6 follow-up: Yep, our counter especially seems to undercount if multiple cycles are passing at the same time. To proof that someone took a video of the #Zurich bicycle tunnel counter while the #CriticalMass passed by and shared it via the Telegram group https://t.me/+TH_vtD0lxwBFe2O1 whose content is by default "under Creative Commons", hence I'm sharing it here, too.

#CMZH #Stadttunnel #Velotunnel #bikecounter

Fremont Bridge bike counts continued to climb in 2024 leading up to return-to-office mandates

Check my math or duplicate this messy Google Doc to play around with the numbers yourself. Let us know what you find in the comments below.

The number of people biking across the Fremont Bridge in 2024 clocked in at 931,637, up 3% over 2023 and the largest total measured since the COVID-19 pandemic.

2025 is shaping up to be a big test both for the downtown workplace economy as well as efforts to encourage people to commute by bike. Office vacancy remains stubbornly high, but several major employers have instituted return to office mandates for employees. Amazon’s return to office policy kicked in January 2025, for example, so the 2024 numbers here will serve as something of a baseline measurement for how well Seattle does at encouraging bike commutes as part of the effort to reenergize the state’s top employment center.

The numbers show that 2019 remains a behemoth year for biking in Seattle. Many years of consistent advocacy and workplace organizing efforts created a culture of bike commuting that was elevating to the next level just as the pandemic blew in and scrambled the city’s travel, worksite and commute patterns. The bike counts are building back up, and 2024 has officially passed 2013 despite the struggling daily downtown job numbers, but there’s still a long way to go.

2019’s numbers might be a bit ambitious for 2025, but can we reach 1 million? That’s right, the race to 1 million bike trips is back, baby!

The monthly breakdown shows that 2024 had a very strong late winter and early spring as well as decent showings in July, September, October and December. Looking at the monthly data suggests that 2024 would have smashed the 2023 figures if not for a middling May. May 2024 was significantly rainier than 2023, including the week of Bike Everywhere Day when the numbers can really balloon if the weather agrees due to all the new rider encouragement programs during that time. It makes sense that new or occasional bike commuters are more sensitive to weather than all you everyday riders with a full set of rain gear. Bike Everywhere Day 2024 measured half as many bike trips as 2023, for example. As a result, May 2024 bike counts were down 10% in May compared to 2023, and that prevented the annual percentage growth from being significantly higher than 3%.

We focus on the Fremont Bridge bike counter because it is the best single point we have to measure the city’s biking pulse and it has the most complete and long-running dataset. You can also audit the counter in person just by watching the numbers tick away on the display on the northwest side of the bridge, which ensures we are not getting faulty readings. Several major bike routes all converge to cross this one bridge (and yes, it counts both sidewalks even though there is only a display on one side). The downsides to this counter are that we are only getting a snapshot of northend biking that is headed toward the city center. The figures are therefore highly sensitive to bike commute trips to downtown workplaces. We saw during the pandemic shutdowns, for example, that weekend biking was way up, but the commute peaks were way down. People were biking a lot since it was one of the few activities available, but they weren’t necessarily crossing the Fremont Bridge since they were less likely to be headed to a downtown workplace.

While office work like Amazon tech jobs get most the news attention, the Downtown Seattle Association reports that retail jobs were down 19% in 2023 compared to 2010. There are many non-desk jobs that support a thriving downtown, and all these workers also need to commute. Major declines in retail work signifies declines in nearly every kind of downtown job. Business groups are hoping that return to office mandates also help rebuild the larger downtown economic structure, and 2025 will be a big test of that idea. For our purposes in this post, these issues are all academic because the Fremont bike counter does not care what kind of job you have. Every bike trip counts as one.

Regardless of how anyone feels about those mandates themselves, a potentially unprecedented number of people may be looking for help getting started as new bike commuters. A lot of people have moved to Seattle since the pandemic, but have never had to deal with typical rush hour commuting. As so many readers of this blog know, biking is by far the best way to get around town during heavy travel times. But biking to work for the first time can be intimidating, and programs supporting first-time bike commuters can go a long way. Workplaces will need to rebuild their bike commute encouragement programs, advocacy groups will need to expand their programs and events, and the city will need to monitor all the great bike infrastructure built since 2019 to see how it holds up under the new traffic patterns.

Stay tuned for a follow-up post looking at data from the Spokane Street Bridge.

#SEAbikes #Seattle

Manhattan Bridge bike counter, 9/22/2024 at 17:36.

#bikecounter #BikeNYC #BikeTooter

Manhattan Bridge bike counter, 9/19/2024 at 22:58.

Not sure if I’ve ever seen the daily count this high before.

#bikecounter #BikeNYC #BikeTooter

Manhattan Bridge bike counter, 9/14/2024 at 19:07.

#BikeNyc #BikeTooter #bikecounter

Manhattan Bridge bike counter, 8/27/2024 at 22:54.

#BikeNyc #BikeTooter #bikecounter