🎉 Last night, @jona received the Designpreis Brandenburg for the project »I Want a Better Catastrophe« in the category: Digital Design, UX/UI, Game Design Young Professionals! 👏

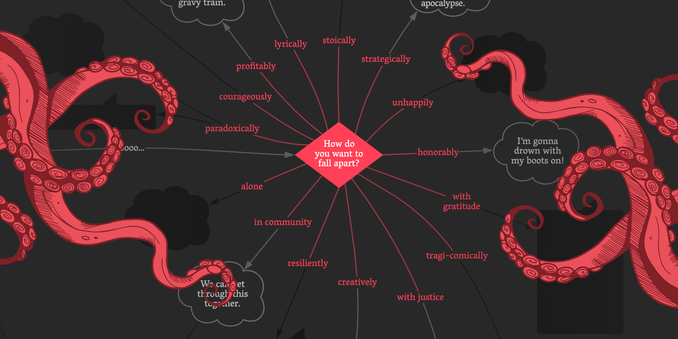
The interface connects audio narration with open-ended exploration, offering new ways to navigate the complexities of the climate crisis. It is available as a free template!

▶️ https://flowchart.bettercatastrophe.com

📄 https://uclab.fh-potsdam.de/projects/interactive-flowchart

🏆 https://designpreis-brandenburg.de/ausgezeichnet/

#BetterCatastrophe #Flowchart #InterfaceDesign #FHPotsdam

I Want a Better Catastrophe · Flowchart

A flowchart for navigating our climate predicament

🎉 The Information is Beautiful Awards were just announced at #Outlier2025 and we are thrilled and thankful to receive Gold with »I Want a Better Catastrophe: A Flowchart for Navigating our Climate Predicament« by #AndrewBoyd, @jona & @nrchtct

🔥 Try it out: https://flowchart.bettercatastrophe.com

🏆 Entry on award website:
https://www.informationisbeautifulawards.com/showcase/7487-i-want-a-better-catastrophe-a-flowchart-for-navigating-our-climate-predicament

🛠️ Create your own interactive flowchart: http://uclab.fh-potsdam.de/interactive-flowchart/

#Outlier2025 #IIBAwards #DataVizSociety #BetterCatastrophe #DataVis #InterfaceDesign #FHPotsdam

I Want a Better Catastrophe · Flowchart

A flowchart for navigating our climate predicament

🔥 »I Want a Better Catastrophe« made it onto the short list of the Information is Beautiful Awards in the “Places, Spaces & Environment” category.

The flowchart by @jona combines audio narration with interactive elements as an invitation to join #AndrewBoyd on his narrative path and explore our predicament on your own: https://flowchart.bettercatastrophe.com

You can find all other short-listed entries here: https://www.informationisbeautifulawards.com/showcase?action=index&award=2024&controller=showcase&page=1&pcategory=short-list&type=awards

#IIBAwards #BetterCatastrophe #Flowchart #DataVis #InterfaceDesign #FHPotsdam

I Want a Better Catastrophe · Flowchart

A flowchart for navigating our climate predicament

🔥 Das interaktive Flowchart zur Klimakrise von Andrew Boyd ist nun auf Deutsch verfügbar: https://flowchart.bettercatastrophe.com/de/

Übersetzt wurde das Flowchart im Rahmen der Buchveröffentlichung »Klima, Kollaps, Kommunikation – Perspektiven auf das Climate Endgame«:
📢 https://klima-kollaps-kommunikation.de

#KlimaKrise #Wissenschaftskommunikation #Wisskomm #Klimakommunikation #Flowchart #BetterCatastrophe #FHPotsdam

I Want a Better Catastrophe · Flowchart

Flowchart für einen Weg durch unser Klima-Dilemma

Nach Mitarbeit an #AlanMoore|s »#Jerusalem« für den #CarcosaVerlag mach ich weiter mit Übersetzung der #BetterCatastrophe Flowchart von #AndrewBoyd für #KlimaEndspiel-Projekt vom Leibniz Institut, bzw. Institut für Meteorologie und Klimatologie Hochschule Hannover -> https://endspiel.website.
Höre gerade zum 1 x, wie ein professioneller Sprechhandwerker mit meiner Arbeit zurechtkommt.

Würde ja durchaus gern ganzes #BessereKatastrophe-Buch machen.

Klima Endspiel

@smallcircles @impactology @stephenpa

Thank you for the kind words! All praise to @jona, who created the interactive flowchart during his student research in the @uclab_potsdam, and to #AndrewBoyd, who wrote the #BetterCatastrophe book and reached out to us in the first place. We now have a joint paper under review for @jovi – so stay tuned.

In the meantime, you might also like the flowcharts by our students using the #InteractiveFlowchart:
https://uclab.fh-potsdam.de/interactive-flowchart/projects/

#InterfaceDesign #FHPotsdam

Project Course · Interactive Flowchart · Fall 2023 · FH Potsdam

Results from a one-week block course devoted to the creation of interactive flowcharts. Students were tasked with creating and illustrating a flowchart about a dilemma of their choice, narrating a path through the chart using an audio recording, and making their creations interactive using a provided template.

I Want a Better Catastrophe · Flowchart

A flowchart for navigating our climate predicament

Last week @jona Pomerance presented the interactive and narrated #BetterCatastrophe flowchart at #infoplus2023 in Edinburgh. For this occasion we also released Interactive Flowchart as a free reusable template with detailed explanations of its structure, a visual step-by-step tutorial, and 12 student examples covering a range of well-known personal dilemmas.

Find everything compiled here:
https://uclab.fh-potsdam.de/interactive-flowchart/

#Flowchart #Datavis #Infodesign #Storytelling #FHPotsdam

GitHub - uclab-potsdam/interactive-flowchart: Navigating and narrating complexity through exploration and storytelling

Navigating and narrating complexity through exploration and storytelling - uclab-potsdam/interactive-flowchart

GitHub

🧳 We are getting ready for @InfoPlusConf in a few days in Edinburgh!

@fidel Thomet and Nadia Zeissig will exhibit Xingú Entangled from the #AmazoniaFutureLab project and @jona Pomerance will talk about the interactive and narrated flowchart about #BetterCatastrophe.

🌿 https://amazoniafuturelab.fh-potsdam.de
🦑 https://flowchart.bettercatastrophe.com

We look forward to meet and mingle with old and new friends!

#infoplus2023 #DataVis #Storytelling #InterfaceDesign #FHPotsdam #AmazonasFutureLab

Amazonia Future Lab: Connect – Comprehend – Communicate

Amazonia Future Lab” is a pilot project based on objects from multiple collections, aiming to overcome disciplinary, institutional and spatial boundaries and to create digital and analog spaces of networking, mutual understanding and mediation.

Schräg: #AndrewBoyd hat sein »I Want a #BetterCatastrophe« (2023) dieses Jahr auch an der FH Potsdam vorgestellt, die mittlerweile auch die wunderbare Flowchart technisch aufgepimpt haben. ABER es gibt derweil noch keine deutsche Version (außer von mir privat auf Anfrage) oder Aussicht auf Übersetzung des Buches.
»A flowchart for navigating our climate predicament« gibts nun also als ganzes, zum Entdecken oder mit geführter Audio-Erzählung.
#IchWillEineBessereKatastrophe https://flowchart.bettercatastrophe.com
I Want a Better Catastrophe · Flowchart

A flowchart for navigating our climate predicament