| site | https://tulpinteractive.com |
| https://twitter.com/JanWillemTulp | |
| https://nl.pinterest.com/janwillemtulp/ | |
| my course | https://creativedataviz.com |

| site | https://tulpinteractive.com |
| https://twitter.com/JanWillemTulp | |
| https://nl.pinterest.com/janwillemtulp/ | |
| my course | https://creativedataviz.com |

On May 21st I am speaking at the 1st Amsterdam Data Design Den meetup: "Beyond the Graph: Humanizing Data Through Design" at ALab Amsterdam.
If you're interested in how design can make complex data more accessible and engaging, then I hope to see you there.
More details here: https://lu.ma/d0ih55vs
Yesterday I gave a talk at the #EUOpenDataDays2025 in Luxembourg. You can watch my talk on #dataviz (and the others) here: https://www.youtube.com/live/WaMV6eIGgJY?si=eKcEWpKGmxjHKGC7&t=17405
P.S. I must say that I don't often paint a wooden box as part of my talk preparation 😁🎨 #eu #opendata #EUODD2025


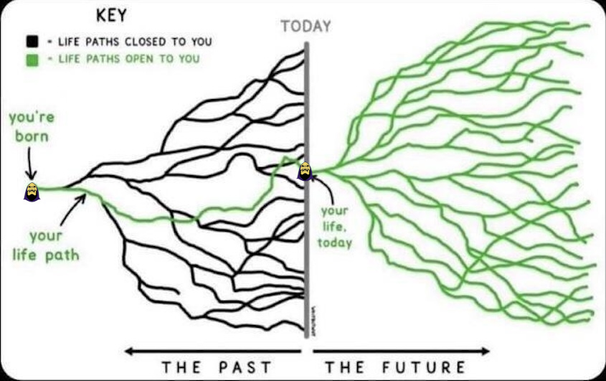
Over the past decade, interactive data visualization has gone from bold experimentation to polished, predictable formats. I’ve been reflecting on why—and after speaking with some of the best in the field, I have some theories. Here’s a look at what shaped the last 10 years and where we might be headed next.