A quick #introduction using an obscene number of hashtags to hopefully reach people I want to be in community with! I make #art and #software and particularly like #linocuts and #embroidery and I also enjoy #visiblemending.

On the tech side my pet topics are currently #datavis (currently looking at #publictransport in my area) and #rdf #ontologies (what can we practically and ethically do with them?)

Would love to follow you if you're interested in any of these things.

Happy birthday to founder of modern nursing, social reformer, statistician, data visualization innovator and writer Florence Nightingale (1820 – 1910)!⁠
Nightingale earned the nickname “The Lady with the Lamp” during the Crimean War, from a phrase used by The Times, describing her as a “ministering angel” making her solitary rounds of the hospital at night with “a little lamp in her hand”. 🧵1/

https://minouette.etsy.com/listing/198661732

#linocut printmaking #sciart #womenInSTEM #datavis #nursing

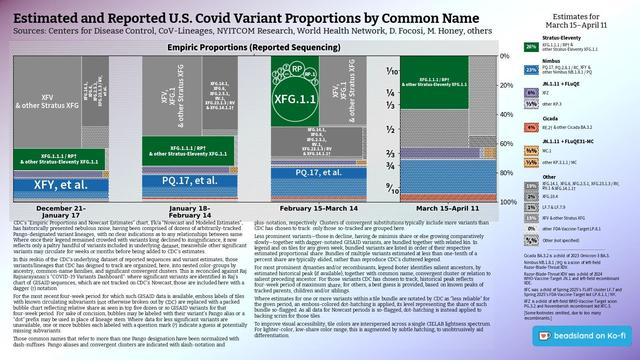
Most recent #CDC dataset, updated late Friday, omits Nowcast for the most recent four-week period, "[d]ue to low numbers of sequences being reported to CDC", but does finally acknowledge spread of Cicada BA.3.2.

Stratus-Eleventy XFG.1.1 continued to hold out in March-April reporting, as other Stratus lineages lost ground to three-pronged spread of Cicada, Nimbus NB.1.8.1 / PQ family, and seemingly-resurgent JN.1.11 + FLuQE, lead by the XFZ recombinant.

Note that, in absence of robust data from states, CDC has given up modeling historical estimates, instead giving only shares of reported sequences.

Raj's dashboard, updated end of March, showed XFG.1.1 at a quarter share, for the last half of the most recent reporting period, while Cicada grandkid RE.2 made a significant appearance.

That said, said GISAID data was dominated by paltry submissions from New York (171), Minnesota (85), Maryland (84), Nebraska (53), and Arizona (17).

#ThisIsOurPolio #variants #CovidIsNotOver #dataviz #datavis

#Annoplot #dataviz have had only minor maintenance this month. Previous status found here:

https://beige.party/@beadsland/116384772463861803

Maintenance to devpie (this chart) #datavis script included new commandline arguments; tweaks to variants script included handling non-standard CDC datasets and rendering of treecharts in orchard chart.

RE: https://chaos.social/@markus_netzpolitik/116532228181345045

Hallo an die Expert:innen zu #DataVis #DataViz #MapChallenge #30DaysMapChallenge & Co.

Wäre Lobbyismus, Einfluss von BigTech und so weiter nicht auch mal ein Thema für Euch?

Wir freuen uns über weitere Themen-Felder und Sektoren, die visualisiert werden. (Bitte pingt uns an, wir helfen mit dem Verbreiten Eurer Visualisierungen). 🙂

Lasst Euch inspirieren von @digitalrechte und der #LobbyLandkarte zu #NetzPolitik 👇🏼

#Cantor, KDE’s frontend for mathematical software and the engine behind #LabPlot’s notebook interface, just received a major update to version 26.04! 🚀  

Highlights include:
👉 Integration with KTextEditor for a modern editing experience,
👉 Improved variable handling with cross-backend autocompletion,
👉 Reworked #LaTeX rendering pipeline for faster,
👉 More reliable previews.

Read the announcement here:
👉 https://cantor.kde.org/blog/2026-04-26-cantor-26-04/

#LabPlot #OpenSource #FOSS #FLOSS #Python #DataVis

Visualisierung von Daten der Kulturstatistik
Entwicklung der Sendezeit von Musik- und Wortsendungen der Öffentlich-rechtlichen Rundfunkanstalten in Deutschland.
#rstats #datavis #opendata

"… bis Anfang 2027 zusammengenommen mindestens 16 Radioprogramme einsparen. Künftig soll jede ARD-Anstalt nämlich bloß noch je vier Wellen betreiben dürfen, dazu pro sechs Millionen Einwohnern im Sendegebiet eine weitere."
https://www.sueddeutsche.de/medien/ard-radio-reform-streichung-von-programmen-li.3274437

Daten
https://www-genesis.destatis.de/datenbank/online/statistic/21611/table/21611-0020
Code
https://github.com/wahlatlas/api/tree/main/kulturstatistik

How boys and girls differ when it comes to cycling accidents on the road and then later in life (we don't have data on how much each group cycles). #datavis #rstats

Using #ggauto by @nrennie

Data
https://www-genesis.destatis.de/datenbank/online/statistic/46241/table/46241-0011
Code
https://github.com/wahlatlas/api/blob/main/personal_injury_accidents_by_age_sex_bike.R

Many hours of fiddling mean that I can parse the XML into something which I can munge in R and make relatively pretty plots with ggplot.
There is no way I am going to try mixing R into any back end of any device, but I've managed to make something which can read the open data, so I could notionally do it again.
https://www.ieso.ca/Power-Data/Data-Directory#Generator-Output-and-Capability
#DataVis #GreenEnergy #electricity
@bertrik @revspace @bert_hubert

This data story by #Tagesspiegel just won a European Digital Publishing Award in data journalism:

https://interaktiv.tagesspiegel.de/lab/wo-berlins-private-pools-stehen-und-was-das-uber-die-stadt-verraet-luftbilder-hitze-wasser-ungleichheit-datenanalyse/

In 2024, @lehmann and I co-taught Mapping Cities – Making Cities to students of #InterfaceDesign and #UrbanFutures and one team asked: is access to a pool a matter of privilege? This question sparked an in-depth investigation that led to a surprising finding…

More about the course: https://uclab.fh-potsdam.de/mapping/

#DataJournalism #DataVis #Berlin #UrbaneZukunft #FHPotsdam

Wo Berlins private Pools stehen – und was das über die Stadt verrät

Berlin wird heißer – und Abkühlung zum Luxus. Mithilfe von KI haben wir erstmals Privat-Pools in der Hauptstadt gezählt. Das Muster ist eindeutig – und überraschend: von Platz, Wasser und neuer Ungleichheit.

Tagesspiegel