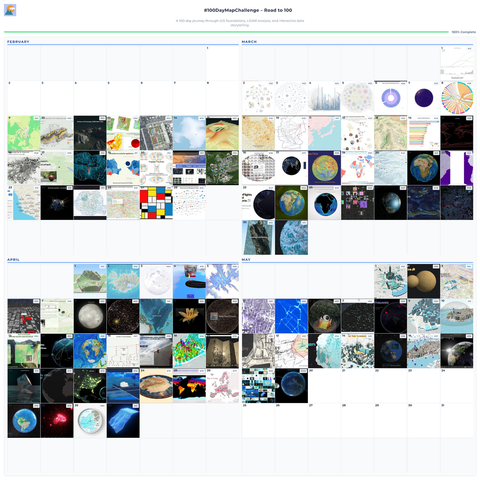
Largest 3D Universe Map Released

Largest 3D Universe Map Released
Feb 9 → May 19, 2026.
100 consecutive days of GIS, 3D maps, WebGL, client work, experiments, and spatial storytelling.
I collected the full campaign in an interactive calendar:
https://maptheclouds.com/100-day-map-challenge/stats/
The campaign is complete. I’m open to selective collaborations on spatial platforms, 3D visualization, and interactive mapping systems.
Huge thanks to everyone who followed along. 🚀
#100DayMapChallenge #3DMaps #GIS #WebGL #ThreeJS #Geospatial
Day 100. Silent Moon 🌘
When Artemis II carried four humans around the far side of the Moon again, the story was easy to follow, but the trajectory still felt abstract. A browser scene where the mission path stays readable in motion: orbital vector context, scroll-driven narrative, camera locks, then atmosphere and contrast for dark space.
Still a WIP. Day 100 of #100DayMapChallenge complete. Thank you for following. The work continues. ❤️
Day 99. Campaign Reflection 🎉
Not every post was a map. 99/100 days. Toolchain grew from QGIS and D3.js into Three.js, MapLibre, React 19, and AI-assisted dev in Cursor.
A few that stayed: discipline beats inspiration, shipping beats perfecting, technical skills compound, AI in the workflow not at the wheel (Inner Fire proved it AI helpers, all human-reviewed), community makes solo work meaningful.
Day 100 arrives tomorrow.

Day 98. The Earth in Blender 🌍
A careful Blender pass through modeling, materials, and light can be as useful as another live dataset when the goal is clarity. Inspiration: Andrew Price’s Earth tutorial.
The first globe pushed from blockout to finished render, it sparked the question that later drove browser-first, real-time spatial work: what if this were interactive, not static?
https://maptheclouds.com/playground/dataviz/blender-earth/
#100DayMapChallenge Day 98/100
Korea Times: Naver turns all of Seoul into 3D digital map experience. “Naver said Friday that its Naver Map platform has expanded coverage of its ‘Flying View 3D’ service across the entire capital, allowing users to virtually navigate Seoul’s landmarks, neighborhoods and natural scenery in high-resolution 3D imagery.”
https://rbfirehose.com/2026/05/16/korea-times-naver-turns-all-of-seoul-into-3d-digital-map-experience/Day 97. Hot air balloons everywhere! 🪂
Late-campaign lightweight piece: one clear visual idea, but still built on a proper geospatial stack.
Hot air balloon glTF above dense 3D buildings in Mapbox GL JS, with animation + lighting in a custom Three.js layer rendered over the map WebGL canvas.
Playful interaction, geographically anchored.
https://maptheclouds.com/playground/buildings-experiments/balloon/
#100DayMapChallenge Day 97/100
#ThreeJS #WebGL #MapboxGL #MapTiler #Geospatial #CreativeCoding #Animation #3DMaps
Day 95. In The Clouds 🏢
In The Clouds explores supertall architecture through a playful interactive map where landmark towers are rebuilt as stacked, brick-like forms.
It grows from Day 82, Lego City 🧱.
Implementation: MapLibre GL JS + custom Three.js/WebGL layer, GSAP transitions, CSV building metadata, and GeoJSON overlays for filtering and comparisons.
Featured in the WebGL/WebGPU showcase. 🔗
https://maptheclouds.com/intheclouds/
#100DayMapChallenge Day 95/100 #3DMaps #GIS #ThreeJS #MapLibre
Day 94. Cluj County forests, România 🌳💚
Quieter, more personal chapter after playful map experiments: Cluj County as one continuous story of canopy + relief.
Workflow stays grounded in QGIS preprocessing and Three.js/WebGL rendering, while swipe interaction makes mountain growth feel tactile instead of purely visual.
https://maptheclouds.com/playground/30-day-map-challenge-2022/cluj-forests/
#100DayMapChallenge Day 94/100
#ThreeJS #WebGL #QGIS #Geospatial #Animation #CreativeCoding #3DMaps