KirellBenzi

14 Followers
86 Following
56 Posts
I try to reveal the hidden beauty of #data. Data Artist, TEDx speaker. Senior Applied Scientist @EPFL. #DataArt #dataviz #AI #creativecoding
Websitehttps://www.kirellbenzi.com
YouTubehttps://youtube.com/c/KirellBenzi1
LinkedInhttps://www.linkedin.com/in/kirellbenzi
Instagramhttps://instagram.com/kirellb

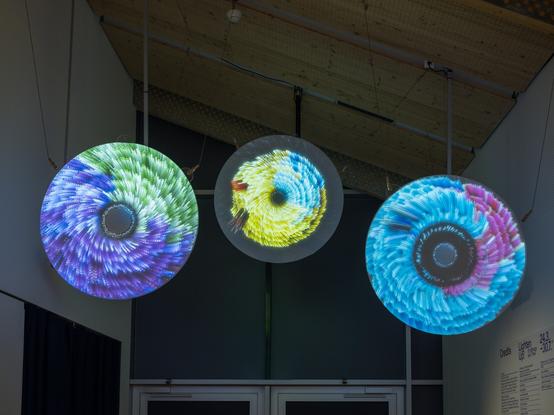
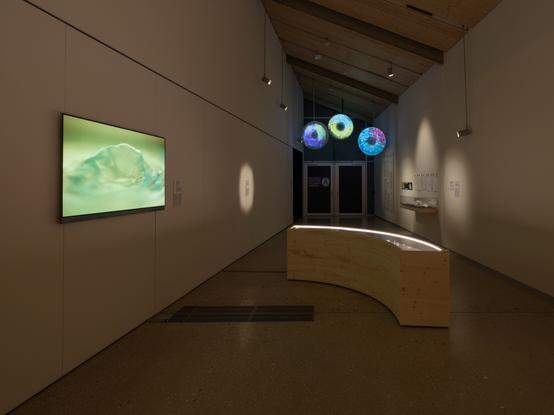
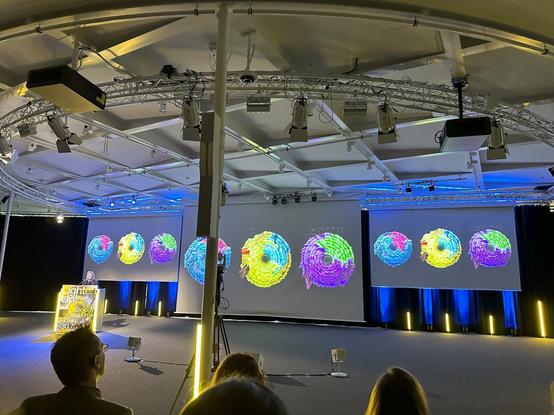
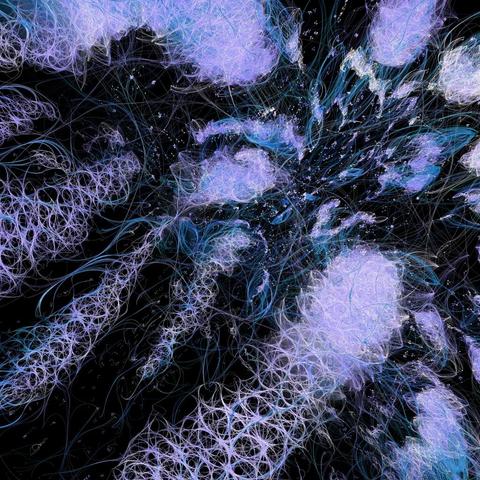
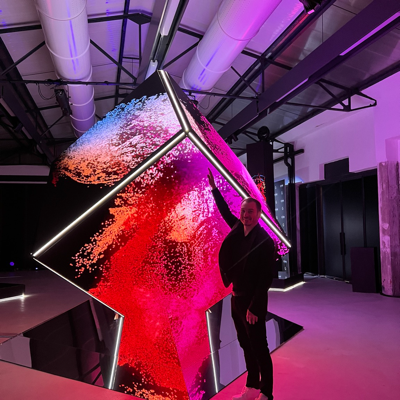
It is my great pleasure to announce that my latest data artwork "Circadian Rhythms" made with Franck Aubry is on display at EPFL Pavilions until the end of July 2023.

More about the piece: https://www.kirellbenzi.com/art/circadian-rhythms

More info about the (free) exhibition: https://epfl-pavilions.ch/exhibitions/lighten-up

'Lighten Up! On Biology and Time' at EPFL Pavilions, Lausanne.
Photos: Julien Gremaud.

#DataArt #dataviz #datavisualization #epfl

Circadian Rhythms - Kirell Benzi

"Circadian Rhythms" is an data-driven art piece created by Dr. Kirell Benzi. It was created by using data science, machine learning, data visualization and creative coding.

Just learned that our interactive data art project in collaboration with Google and Media.Monks won the FWA of the day.

An award recognizing innovative and cutting-edge experiences regardless of the medium or technology used.

Happy to see that data art is becoming more mainstream!

Check it out if interested: https://thefwa.com/cases/fashion-takes-shape

#DataArt #DataViz #Art

Fashion Takes Shape - The FWA

Fashion Takes Shape is an interactive artwork highlighting thousands of fashion brands through 3D visualisations that you can interact with to see its

The FWA

I always like seeing what comes out of the challenge and what it teaches us about the state of the dataviz industry.

Let's see what the 2022 edition will bring.

Click to see how you can participate. Deadline: May 14.

#dataviz #dvs #datavisualizationsociety #soti

https://www.datavisualizationsociety.org/soti-challenge-2022

SOTI Challenge 2022 — Data Visualization Society

Data Visualization Society

New data-driven art piece to start 2023. This one is called "Triumph".

The artwork visualizes the connections between patients based on their microbial makeup, with some signatures reflecting underlying infectious diseases and others potentially relevant to other therapeutic areas.

More about it here: https://www.kirellbenzi.com/art/triumph

#dataart #dataviz #genomics #biotech #machinelearning

Triumph - Kirell Benzi

"Triumph" is an data-driven art piece created by Dr. Kirell Benzi. It was created by using data science, machine learning, data visualization and creative coding.

Just going to ask bluntly:
Does anyone have a project where I can be of service?
I can help you out with creative datavisualization design, can bring datavisualization knowledge into your company through advise and healthy criticism, guide you on your way on designing your own insightful graphs and other visualizations.

Just give me a shoutout and spread the word, I appreciate your recommendations :-))

#datavisualization #design #illustration #work #jobhunt

@jhilden I noticed the same thing!

Perhaps the worst data visualization job on the internet so far.. 🙄

#data #visualization

I am visually coding the intricacies of the clusters and bridges of a large network (AI in science). It looks like this.

That part is health. It's the most entangled. Each lump and road has been analyzed qualitatively by @AndersKMunk, Matilde Ficozzi, and I.

@texone Any juicy news on when the new version of fuse is coming out?
Looking into unifying the drawing nodes for the #vvvv #fuse computesystem. By Creating a vertex view the output buffer of the compute system can be directly used for rendering. Here is an example for the box renderer that is implemented as material extension.