Statistics Globe

@StatisticsGlobe
369 Followers
5 Following
679 Posts

Hi, I’m Joachim Schork, the guy behind Statistics Globe. I provide R & Python programming as well as statistics & data science content.

Website: https://statisticsglobe.com/
YouTube: https://www.youtube.com/@StatisticsGlobe

#rstats #python #statistics #datascience

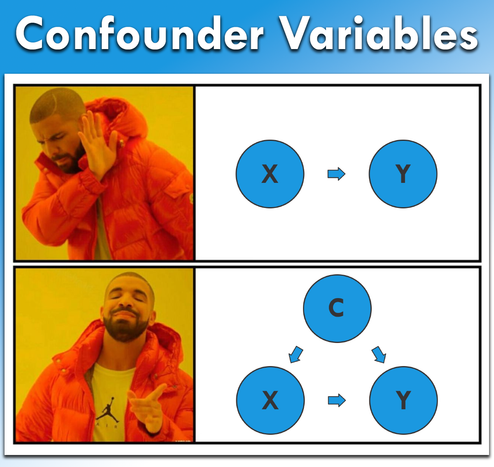
Confounder variables can distort the relationship between two variables and lead to misleading conclusions if they are not properly accounted for.

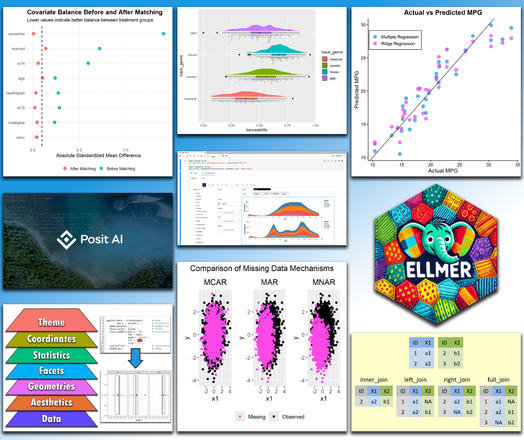
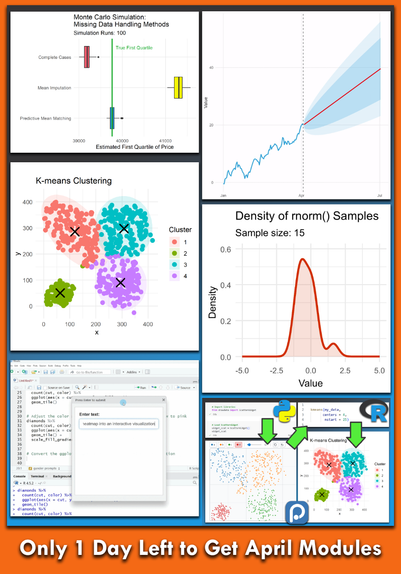
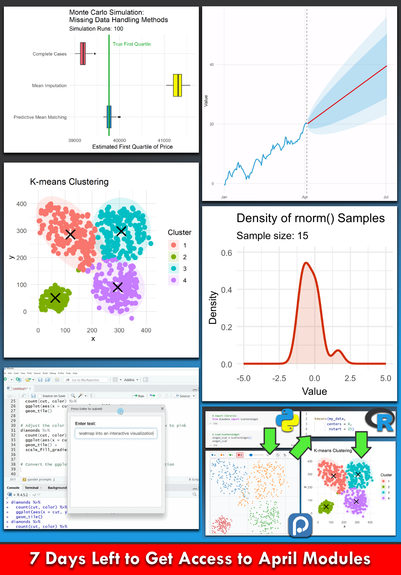
Learn more in a recent Statistics Globe Hub module: https://statisticsglobe.com/hub

#rstats #statistics #datascience #datavisualization #regression #analytics

Registration for the Statistics Globe Hub and all Statistics Globe courses will close in one week: https://statisticsglobe.com/courses

I’ll be on vacation until June 15 and won’t be able to process enrollments during that time.

#statistics #datascience #rstats #python #machinelearning #ai

The newly released Posit Assistant is changing the way we can work with R and Python. It is an AI assistant integrated directly into the RStudio and Positron IDEs.

New Statistics Globe Hub module: https://statisticsglobe.com/hub

#rstats #python #ai #datascience #statistics #rstudio #statisticsglobehub

Only 3 days left before the next series of modules in the Statistics Globe Hub begins: https://statisticsglobe.com/hub

The image below gives you a preview of some of the graphs and topics we will explore in the coming weeks.

#RStats #Python #DataScience #MachineLearning #AI #DataVisualization #Statistics

A new batch of modules in the Statistics Globe Hub is about to start.

You can find more information about the Statistics Globe Hub, along with the full list of upcoming module topics, here: https://statisticsglobe.com/hub

#rstats #Python #DataScience #MachineLearning #Statistics #AI #StatisticsGlobeHub

Your data may be telling you the opposite of the truth.

In a recent Statistics Globe Hub module, you’ll learn how Simpson’s Paradox arises, how to spot it, and how to analyze it in R: https://statisticsglobe.com/hub

#rstats #statistics #datascience

Final reminder: Registration for the April modules of the Statistics Globe Hub closes at the end of today.

Enrollment has been going very well so far, with many new members joining the community.

More info: https://statisticsglobe.com/hub

#datascience #statistics #ai #rstats #python #statisticsglobehub

Only 1 day left to secure access to all Statistics Globe Hub modules released in April: https://statisticsglobe.com/hub

🔹 Draw Synthetic Datasets with drawdata in Python
🔹 Monte Carlo Simulation
🔹 AI-Assisted Coding with gander in R
🔹 Animated Visualization with magick in R

#statistics #ai #rstats #python

AI can generate answers quickly. But how do you know if those answers are actually correct?

Free virtual event: The Semantic Layer Summit 2026

More info: https://www.semanticlayersummit.com/?utm_medium=social&utm_source=linkedin&utm_campaign=2026sls&utm_content=eggflame&utm_term=schork

#AI #DataScience #DataAnalytics #MachineLearning #BusinessIntelligence #Statistics

Access to the Statistics Globe Hub April modules is only available to those who join this month: https://statisticsglobe.com/hub

🔹 Draw Synthetic Data with drawdata in Python
🔹 Monte Carlo Simulation
🔹 AI-Assisted Coding with gander in R
🔹 Animated Visualization with magick in R

#Statistics #AI #RStats