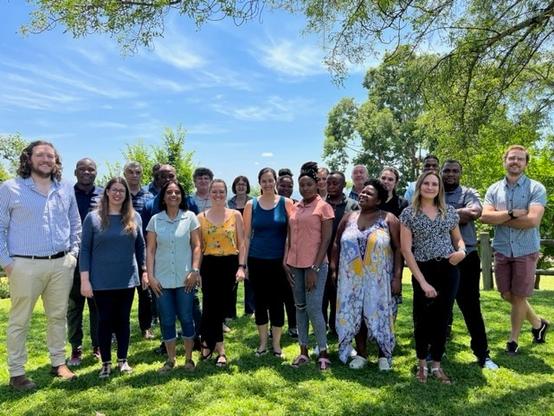
I had the pleasure of teaching a 5-day workshop on experimental design, statistics and #Rstats to a bunch of awesome researchers at Citrus Research International in Nelspruit. Thanks for having me!!! I can't wait to come back. 😎

Entomologist by day, stats-geek by night. #RStats and #JuliaLang enthusiast.
Check out my research: https://scholar.google.com/citations?user=vV1bAk0AAAAJ&hl=en
| About me | Entomologist by day, stats-geek by night. #RStats and #JuliaLang enthusiast. |
Species distribution models (SDM's) are frequently to prioritise sites to release weed biocontrol agents, but to date, whether this method results in increased agent establishment rates has not been tested.
In our new paper, we retrospectively showed a positive correlation between MaxEnt suitability scores with establishment of an insect introduced into South Africa from Australia to control an invasive tree. All done in #RStats
Check it out: https://www.sciencedirect.com/science/article/abs/pii/S030438002200240X
Just added a new post about our forest aboveground biomass paper to my blog, over at:
I have grappled with how to draw a good map using #JuliaLang for a while now, after switching from #RStats.
This is what I have come up with: feedback is welcomed (especially if anyone can advise how I can add a North arrow and scale bar inside the plotting window?):


