For the 4th year in a row, my all-sky camera has been taking an image of the sky above the Netherlands every 15 seconds. Combining these images reveal the length of the night changing throughout the year, the passage of clouds and the motion of the Moon and the Sun through the sky. #astrophotography
The year-long keogram is constructed from daily keograms, where each daily keogram takes the central pixel column of the all-sky images of each successive image to show motion in the sky. This video shows the all-sky images for a 24h time span and the resulting keogram shown below.
Zooming in on the daily keograms, the motion of celestial objects becomes clear. These daily keograms from January 16th to February 2nd 2024 show the Moon moving across the sky. It starts at sunset near first quarter, culminates around full moon, and ends at sunrise near last quarter.
Similarly, the stars move across the sky. During June, when the nights on the Northern hemisphere are short and the sky does not fully darken, the bright star Vega is high in the sky. Over these 12 daily keograms, we see Vega moving slowly left by 4 minutes every day.
During 2024 there were two nights with Northern Lights that were relatively clear. The keograms of those nights captured the colors and motion of the Aurora Borealis. Keograms were specifically designed to study the Aurora: https://victoriaweather.ca/keogram.php.
School-Based Weather Station Network -- Keogram, Single Image of All Day Sky Cloud Conditions

Weather Station Network of Climate Modelling Group of the School of Earth and Ocean Sciences, University of Victoria, Victoria, British Columbia, Canada

The all-sky camera consists of a ZWO ASI178MC color camera with a 2.5mm F/1.2 fish-eye lens. A small Raspberry Pi computer operates the camera and sets the exposure time and camera gain based on the sky brightness. It also controls a dew heater and a fan to prevent condensation on the acrylic dome.
I am amazed that this setup has been running smoothly for over 4 years now with almost no problems. The 24/7 operation is required to be able to make these year-long keograms, and I am happy that I can just leave the camera running for such a long time without things breaking (knock on wood).
It is interesting to compare the shape of the 4 separate year-long keograms. The shape of the hourglass stays the same, but the diagonal bands of the Moon moving over the sky change from year to year.
Combining the 8.4 million individual exposures (2TB of data) into a single keogram covering the 4 years from 2021 upto 2025 shows the repeated change in length of the night, and also highlights the small differences in sunset and sunrise times due to the eccentric orbit of the Earth around the Sun.
@cgbassa incredible. Im taking a beginners course (summer school) and am just starting to get my head around celestial objects. This visualisation helps, thank you

@cgbassa there you also see why it's called blue hour 🤩

so so so cool, this whole thing!

@cgbassa i have no idea what a keogram is but i know it's fucking beautiful!
@cgbassa very nice! Do you mind if I ask what software you use? I have a ZWI that's been failing continuously with AllSkeye and it's default software this last year (overheating the computer, freezing up)...
@AstroHyde My software is based on that of the Raspberry Pi allsky software repository: https://github.com/AllskyTeam/allsky I tested out their code back in 2020 and am still using the framework (web controls, automatic start etc), but wrote my own capture code in python to use different exposure logic. (https://github.com/cbassa/asm/blob/master/capture)
GitHub - AllskyTeam/allsky: A Raspberry Pi operated allsky camera

A Raspberry Pi operated allsky camera. Contribute to AllskyTeam/allsky development by creating an account on GitHub.

GitHub
@cgbassa Oh wow. 💜
That gives me a few ideas on what to do with a decade's worth of timelapses i got.
@cgbassa Were you able to connect IR LEDs to an official Pi NOIR camera and which ones do you recommend?
@avipars I have not tested the RPi cameras for this application.
@cgbassa Either way, sweet project!

@cgbassa @juandesant

Very cool! Thank you for sharing!

We are working on a similar project but based on RISC V hardware. Are you open-sourcing the hardware? This will help us avoid mistakes.

@cgbassa
I was fascinated of that bright ball during the night that suddenly disappeared in the middle of the sky when ot became day. It's the moon! And it faded away because everything else became brighter at sunrise. That is so cool to watch!
@limebar
To clarify what is exactly happening, this figure compares the keogram with predictions for rise and set times of the Sun and the Moon.
@cgbassa very nice. Thanks for sharing!
@cgbassa why do the red areas/curves have such a kink in them?
@pandora This is due to the location of the Moon in its orbit along the ecliptic. In winter, the full Moon will be up for longest because the full Moon is happening at the highest point in the sky. That means that the days before or the days after the Moon will be lower in the sky at culmination, leading to it being above the horizon for less. During summer this is reversed. At full Moon the Moon is lowest in the sky and hence up for shortest. In the days before or after it stays above the horizon for longer, which leads to these kinks. I hope that makes sense.

@cgbassa This is very cool.

What software do you use for this?

@cgbassa are the times "true" local times (1200 = sun is the highest) and also not considering DST as far as I can tell?
The dress - Wikipedia

@flo You are not the first to see the resemblance 😆

@cgbassa

The moon! 😍

(Can you explain the asymmetry at the bottom of the image? Why is the time of sunset so constant in December?)

@CelloMomOnCars @cgbassa my understanding is that it's mostly about the change in solar noon (from the varying speed of the earth along its orbit around the sun) partly compensating the change in day length. https://www.timeanddate.com/astronomy/equation-of-time.html has a more technical explanation
Equation of Time

The difference between the time measured by the Sun and the time measured by our clocks is known as the equation of time.

@LeoRJorge @CelloMomOnCars Leo is correct here. The asymmetry is due to the slight eccentricity of the Earth's orbit resulting in the Sun passing the Southern meridian early or late depending on the time of year. It is more obvious with predictions for Sun rise, Sun set and Sun transit times overlaid on the keogram.

@cgbassa

Thank you for adding the overlay, it's really clear now.

(Remind me to help protect science as well as the planet)

@LeoRJorge

@LeoRJorge @cgbassa

Wow that's fascinating!
Thanks for the link.

(Remind me to help protect this planet, it's a cool planet).

@cgbassa have you written about the process of how you made this? It's *exactly* what was in my head when I built my skycam but the processing power to compile the 300k+ pictures was a pain
@coldclimate @cgbassa was wondering the same, it's such a cool data visualisation exercise!
@coldclimate Not in detail as many others before me have written about designing/building all-sky cameras and the software needed to capture individual images and create keograms, see https://github.com/AllskyTeam/allsky/. I've only taken their work a small step further. My main changes have been to the capture software to change the exposure logic to also be able to capture during daytime. All individual exposures are offloaded to storage on another computer. On that I create the daily keograms, which are then combined into these year-long keograms, all with custom python code.
GitHub - AllskyTeam/allsky: A Raspberry Pi operated allsky camera

A Raspberry Pi operated allsky camera. Contribute to AllskyTeam/allsky development by creating an account on GitHub.

GitHub
@cgbassa thank you. I might have a go to revisit this again this year. My code was a lot of bash and ffmpeg
@coldclimate That should also work. Python is a bit easier as the 15 second exposures aren't exactly spaced at 15 second intervals. So I first make a daily keogram from all images of that day, and then interpolate that to integer minutes to give me 1440 columns per keogram (one per minute for 24h).
@cgbassa, I don't see cuts for the daylight saving time adjustments.
@tero That's correct. The local time is essentially kept at CET throughout the year for this plot.
@cgbassa Is the yellow at night light pollution, and are street lights dimmed fromidnight to 06:00 in December? Or is that something else?
@chrysn The yellow is due to low-altitude cloud cover and fog, which, with this camera, comes out as yellowish, probably due to illumination from streetlights. There is no dimming of street lights, more that clouds change color to gray/white in daytime. Here's a plot of all of December 2024.
@cgbassa Nice, it shows New Year's Eve's fireworks even. Still looks like a dark rectangle up and to the right from there, but it's hard to tell whether clouds become less there or human light decreases (car headlights, maybe?)
@chrysn Can you draw on that plot with December which rectangle you mean? There might be some garden lamp on a timer somewhere in the neighborhood that I haven't noticed before.
@cgbassa It's clearest on the clouded days EoY:
@cgbassa
is it black and blue...
or gold and white? 🤔
@wolf480pl You are not the first to make that connection! In this case the sky is blue during the day and black at night (i.e. not gold and white).

@cgbassa how short are your nights in summer?!

(also: so cool! Thanks for sharing!)

@Dubikan @cgbassa it's the Netherlands, so sunset the 21st of July is around 21:45 and sunrise around 5:45 (we're very far West in our timezone, worsened by daylight saving time)
@Dubikan @cgbassa wait uh midsummer is a month earlier, so it's actually closer to 0515/2200
@syn @cgbassa so that's still about 30% night of each cycle - the image seems to show much less night, unless I'm misinterpreting/eyeballing it poorly.
@cgbassa this is gorgeous -- it looks like a painting at first. would love to get a giclée print on canvas or maybe on metal. amazing!
@cgbassa how come the transitions between day and night seem rather abrupt? Shouldn't there be a rather gradual brightness fade during dusk and dawn?
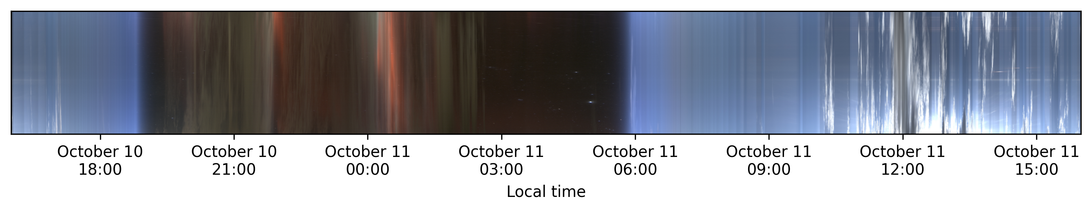
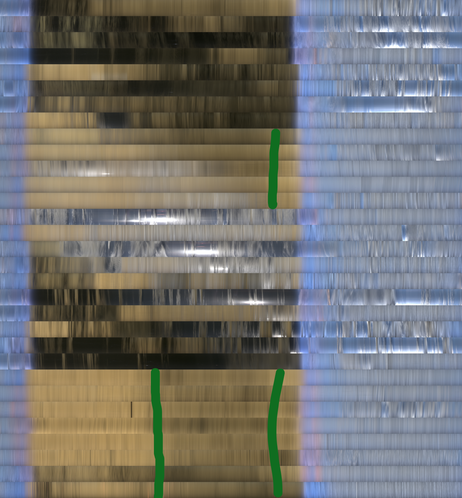
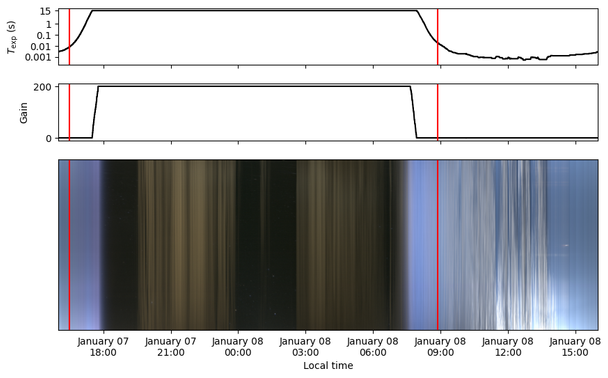
@xxx This is due to the approach I've chosen for the exposure settings. The camera has controls for exposure and gain, and I've implemented the exposure logic such that from daytime to night time, the gain stays at the daytime value until the exposure time increases to 15 seconds. After that, the gain gets to increase to a maximum value. At Sun rise, the opposite happens (gain deceases first, then exposure time). This plot shows the evolution of exposure time and gain during 24h and can be compared to the keogram and the times of Sun set and Sun rise (red vertical lines). It's clear that the transition from in color coincides with the gain change, which occurs in deep twilight.

@cgbassa This is a wonderful presentation of the project. Very well done!

Do you have more detailed instructions on how to build the system? This would be a great project to share with students of physics and astronomy.

Thank you for sharing this!

@cosmicspittle I based the design of my camera on plans from Thomas Jacquin (see https://www.thomasjacquin.com/make-your-own-allsky-camera/ and https://www.instructables.com/Wireless-All-Sky-Camera/). He also started the github repo for software to run on the RPi. That repo has grown quite a bit and now supports other cameras as well. See https://github.com/AllskyTeam/allsky/. It took me a few months to get the system properly weather proofed.
DIY Allsky Camera

@cgbassa Just found a winter project! Thank you 🙏
@cgbassa this is an incredible science Foto!