Journalists on the #fediverse, a very important and ground-breaking poll.
Please boost for reach.
#journalism #JournoLife #polls #drugs #caffeine #coffee #tea #Newstodon
Coffee
Tea
Energy Drinks
Pure Spite / Show results
Poll ended at .
Journalists on the #fediverse, a very important and ground-breaking poll.
Please boost for reach.
#journalism #JournoLife #polls #drugs #caffeine #coffee #tea #Newstodon
It's an unpopular opinion but I am more of a tea drinker. Still sipping on my morning pot of Viennese Earl Gray from Harney & Sons right now.
Although it is of course, sweetened with spite and spiced with the tears of my TERF enemies.
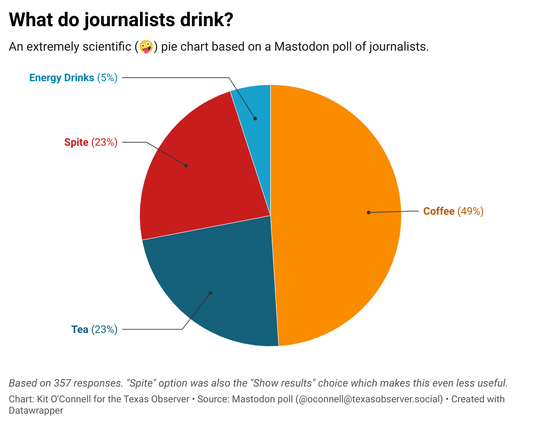
I did a #dataviz class last week and resolved to do at least one visualization per week, so today I'm turning this poll into data visualizations. First, here's #datawrapper. I've embedded the picture but if you click through it is slightly interactive: https://www.datawrapper.de/_/Wjlt1/
I also made the same visualization in #Flourish, which is another essentially free #dataviz tool (you CAN pay for both it and datawrapper but there's not much reason unless you want to hella customize it).
I made this one into a "donut" graph because who doesn't enjoy a donut with your coffee ☕️ or tea 🫖? https://public.flourish.studio/visualisation/13530762/


