Perhaps the worst data visualization job on the internet so far.. πŸ™„

#data #visualization

@berendvdkolk
According to this, I'm a Lilliputian Indonesian. Man, Im terrified of Netherlands giants. If you need me, I'll be cowering behind a big rock, hiding from the Netherlands man.
@berendvdkolk That certainly puts the Dutch East Indies into a new, Swiftian perspective.
@berendvdkolk πŸ˜„πŸ˜„ it looks so studip I lol πŸ˜„
@berendvdkolk Under around 4’10” or so, you start to get bigger again, but upside down
@berendvdkolk given the poor units they use….
@berendvdkolk it's a miracle the Indonesians managed to shake off Dutch colonialism at all with this perspective.
@berendvdkolk why does the Dutchman, the largest man, not simply eat the other men?
@berendvdkolk Maybe it's made by same person who made this 😁
What's the average height for men?

How do you measure up against the average height for men in your country? And what can your height and waistline tell you about your health?

@berendvdkolk Een mooie voor @caal of @ionicasmeets , denk ik.
@berendvdkolk Thanks for sharing. I saved the image for my lesson on misrepresentation of data :).
@berendvdkolk I was today years old when I found out that Indonesia is populated by Oompa-Loompas. πŸ™„
@berendvdkolk This looks like a (deliberate?) copy of the infamous Giant Latvian Women graphic from a couple of years ago. πŸ˜€ https://www.boredpanda.com/average-women-height-data-chart-latvian-indian-women/?utm_source=google&utm_medium=organic&utm_campaign=organic
Someone Posts A Pictograph Of "Average Female Height" And People's Commentary Is Hilarious

With Latvian female giants and tiny Indian women, this questionable piece of data on average female height is having the roast of a lifetime.

Bored Panda
@berendvdkolk the data visualization succesfully illustrates an absurd measuring system
@berendvdkolk fabulous teaching resource! Will use that for sure ;-) thanks for sharing!

@berendvdkolk

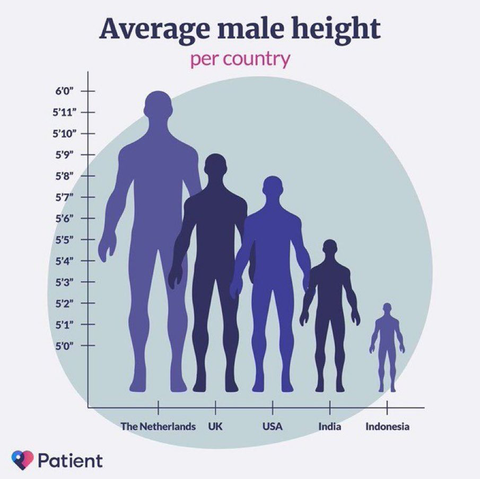
I think a logarithmic scale might have helped here.

Must point out as well, it doesn't specify 'Adult' so the images could very well be correct and the axis is wrong.

@berendvdkolk it’s kind of amazing to demonstrate the importance of data visualization though
@berendvdkolk I had the female counterpart saved, here.
@berendvdkolk Well they *did* find hobbits in Indonesia after all πŸ˜‚
@berendvdkolk And even within the Netherlands there is a clear difference (of 3.39 cm or 1 3/8") in the average height of men in the northern and in the southern provinces, with the northeners being the tallest.

@berendvdkolk

"They might be giants"

"The incredible shrinking man"

@berendvdkolk I'd really like know where their data comes from, I and the majority of other men I know in the US are 6'0 or taller.
@berendvdkolk you must be able to find worse.
@berendvdkolk
Indonesia man can bite Dutch man's knee! 😰
@berendvdkolk
Are you saying Indonesian men aren't knee-high to a Norwegian?
I feel so misled.
@berendvdkolk I kind of liked being depicted as Dr Manhattan
@berendvdkolk it's a typo: Alien Male Height per planet.
@berendvdkolk Data visualization is my passion.
@berendvdkolk I’m in this picture and I don’t like it!
@berendvdkolk So now we really know where Gulliver travelled.
@berendvdkolk not sure... this is bad sure, but like it's the internet... there must be worse... πŸ‘€ 😜
@berendvdkolk good example why you shouldn't crop the Y-axis