The Box You Cannot Check
The clinic intake form on the clipboard at the front desk has two boxes next to the word “sex.” A patient who is neither of the two options has been given three choices: pick one box and lie, write something in the margin, or refuse the form. The receptionist will not read the margin. Data entry clerks will not transcribe it. EHR systems will not store anything outside the two values the form lists. The patient walks out of the clinic with a treatment plan based on a box that does not correspond to their body, their history, or their current endocrine state. The form has done its job, which is not the job it claimed to do.
The form claims to collect information. Its actual function is categorization. Information collection would mean recording what the patient told the clinic. Categorization means sorting the patient into one of the boxes the system already had, regardless of whether the patient fits. These are different operations. The form does the second while presenting itself as doing the first.
I focus on the sex/gender field because it is currently the most visible example of the categorization failure, but the pattern is general. Race fields on most forms still offer five or six options plus an “other” line that researchers routinely discard in aggregate analysis because “other” cannot be merged with the named categories without distorting the comparison the categories were built to support. Ethnicity fields on US forms famously split Hispanic into its own question while leaving Middle Eastern and North African respondents to choose between “White,” “Asian,” and “Other,” none of which describes them. The Census Bureau plans to add a MENA category in 2030, decades after the gap was identified. Respondents could check multiple race boxes for the first time in 2000, which was a real improvement on prior forms. The same census kept the sex question as a binary male/female, the way every US Census has since 1790, on the grounds that adding a third option would compromise the time series.
The time series argument is worth examining because it surfaces what is actually happening. A research instrument that has measured a binary for 230 years has produced 230 years of data that reads the population as binary. Adding a third or fourth or fifth option in 2030 would mean that comparisons between 2020 and 2030 require methodological accommodation. That accommodation is doable, well-documented in survey methodology, and routine when other categories shift. Choosing not to make the accommodation keeps the data legible to historians of a category system that is no longer the category system in use. The form preserves the past at the cost of misrepresenting the present.
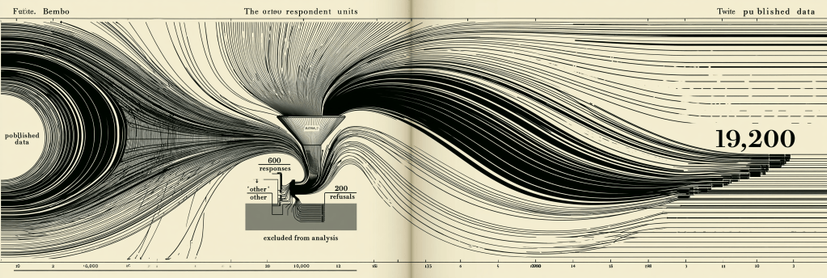
What happens to the data after the form is the harder problem. A survey of 10,000 people that includes 9,200 binary-box-checkers, 600 “other” or write-in responses, and 200 refusals will, in most aggregate reports, appear as a clean 9,200-person dataset. The 600 “other” responses get coded as missing, recoded into the binary categories by an analyst making a judgment call, or dropped entirely under a methodology footnote that says “respondents who declined to specify were excluded from analysis.” Another 200 refusals disappear under one of those clauses. A final published table reads as if 9,200 people answered the question cleanly, when in fact 10,000 people interacted with the question and 800 of them produced data the analyst could not use.
The aggregate therefore summarizes only the inputs that fit the categories already chosen. This is the gap between what the form does and what the form claims to do. The form does classification work while presenting itself as a question. Its classification system was built before the form was printed, and respondents who do not fit that classification are removed from the dataset the form generates. The dataset reads as comprehensive because the cleaning happened before anyone with access to the aggregate could see what was removed.
The mathematical consequence of this should bother statisticians more than it currently does. A dataset that excludes 8 percent of respondents on the grounds that their responses were illegible has an 8 percent selection bias that propagates into every downstream analysis. Confidence intervals computed on the 9,200 do not account for the 800. P-values look strong because the variance in the included data is smaller than the variance in the actual respondent pool. Models trained on the cleaned data fit the cleaned data well and fail in production when they encounter the kind of respondent the cleaning removed. Every machine learning system that classifies people on the basis of survey-derived training data carries this bias forward in ways the system’s documentation almost never describes.
The political consequence is what I think interests the new readers who arrived after the elevator essay. A form that excludes a category of people from the dataset also excludes that category from the policy decisions the dataset informs. A health system that does not record nonbinary patients in a way its analytics engine can read does not know how many nonbinary patients it serves, does not allocate resources to nonbinary patient care, does not train staff to address nonbinary patient needs, and does not appear in funding requests for nonbinary patient programs because the funding agency requires headcount data the EHR cannot produce. The form is upstream of the spreadsheet, the spreadsheet upstream of the budget, the budget upstream of the clinic. By the time the missing patients show up at the front desk, the building has been designed for the patients the form was capable of recording.
A clinic that fixes its form does not solve the problem because the EHR vendor downstream still has a two-value field. Fixing the EHR fails because the state public health reporting system still requires data in the older format. Fixing the state system fails because the federal CDC reporting standard underneath still uses the binary. The categorization is layered. Each layer has a defensible local reason for the binary it inherited. The cumulative effect is a healthcare system that cannot count its actual patient population, and a healthcare system that cannot count cannot fund, and a healthcare system that cannot fund cannot serve. The form on the clipboard at the front desk is the bottom button of a fifteen-story panel where every button on every floor is wired to the same controller, and the controller only stops the elevator on floors the original engineer drew on the original blueprint.
The fix has the same structure as the placebo button fix. Recognize which boxes work and which do not. Refuse to mistake compliance for collection. Push for upstream rewiring of forms before adding more “other” lines downstream. Demand that aggregate reports publish the count of excluded responses in the same table as the included ones, with the same prominence, in the same font. Refuse to treat a survey that loses 8 percent of its respondents as a survey of the population it sampled. Insist on the difference between a question that asks and a question that classifies, and refuse to fill out the second one as if it were the first.
The form is not neutral. It encodes what its designers were willing to recognize, and it discards what its designers were not willing to recognize, and the discard happens silently in the data pipeline rather than visibly at the front desk. A patient who writes a third answer in the margin is doing the work the form refused to do. An aggregate report that publishes 9,200 clean responses hides 800 acts of refusal by people who would not lie to the clipboard. Counting is the claim. Selection is the politics. That politics rides downstream into every room the dataset enters, every dollar the budget allocates, every protocol the staff is trained on, and every body the building was built to serve.
#binary #categorization #category #education #ehrSystems #ethnicity #female #gender #human #male #medicine #MENA #nonbinary #race #sex #tech #timeSeries