
✨ Tidyplots for easy data visualization
🗓 March 25, 2026 | ⏰ 7:00–8:30 PM (PHT)
🎤 Dr. Jan Broder Engler | 💻 Zoom (link after RSVP)
🔗 Register: https://www.meetup.com/r-nvsu/events/313337627/
✨ Tidyplots for easy data visualization
🗓 March 25, 2026 | ⏰ 7:00–8:30 PM (PHT)
🎤 Dr. Jan Broder Engler | 💻 Zoom (link after RSVP)
🔗 Register: https://www.meetup.com/r-nvsu/events/313337627/
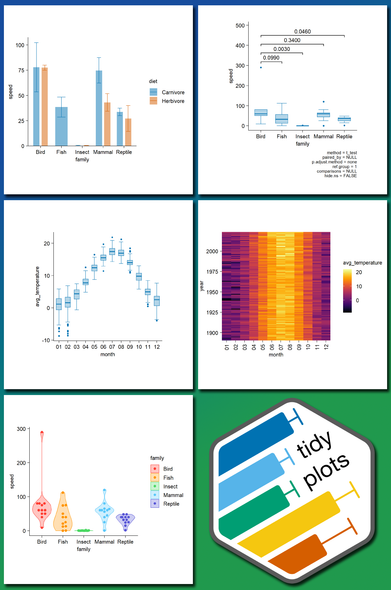
If you regularly create plots in R, the tidyplots package is definitely worth exploring.
Today, I released a new module in the Statistics Globe Hub that explains how to use tidyplots in R.
More info about the Statistics Globe Hub: https://statisticsglobe.com/hub
For data visualization, #tidyplots is fantastic. On the solid bases of other R packages, many of the #tidyverse, it allows rapid creation of multidimensional #barplots, for example. I've updated my previous very short guide for doing this:
https://gitlab.pasteur.fr/csaveanu/R_snippets/-/tree/master/Tridimensional%20barplots%20in%20R

I'm a little bit behind on posting my #30DayChartChallenge plots - so here's Day 15 for the prompt of "Complicated"
📐 Inverted the prompt and made an uncomplicated plot!
📈 Trying the new #tidyplots package in #RStats
🧹 Appreciate the naturally clean chart aesthetics
📊 Still works nicely with #ggplot2 extensions
New podcast episode (#spotLights) in which we talk to the creator of #tidyplots: Jan Broder Engler 🎙
Special thanks to Chee Kiang (Ethan) Ewe, Felipe Del Valle Batalla & Shreya Pramanik 🙏
Ep. 7 🎧: https://www.youtube.com/watch?v=o0kl2kJp1hc&t=1s
Also, please take a look at the related preLights post prepared by Felipe Del Valle Batalla: https://prelights.biologists.com/highlights/tidyplots-empowers-life-scientists-with-easy-code-based-data-visualization/
#rstats #dataviz #phd #podcast #ScienceMastodon #bioinformatics #community #ECRs

