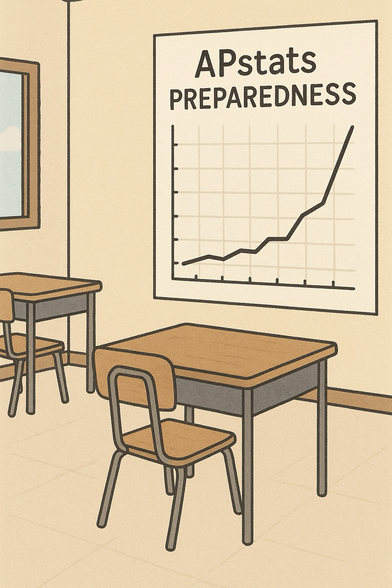
Wrap up your APStats prep with a final push! Get tips from expert exam readers and connect with other sharp minds. You've got this—and can be a contender! bit.ly/apreview2025 #APStats #StatEd #StatsChat #Statistics
Paul Blackwell (Sheffield) will be giving a workshop on "Modelling continuous-time capture-recapture data" on 5 December in Edinburgh. More details here: https://www.eventbrite.co.uk/e/modelling-continuous-time-capture-recapture-data-tickets-718374596757?aff=oddtdtcreator
still some places left!

Spatial confounding is a fundamental issue in spatial regression models which arises because spatial random effects, included to approximate unmeasured spatial variation, are typically not independent of covariates in the model. This can lead to significant bias in covariate effect estimates. The problem is complex and has been the topic of extensive research with sometimes puzzling and seemingly contradictory results. Here, we develop a broad theoretical framework that brings mathematical clarity to the mechanisms of spatial confounding, providing explicit analytical expressions for the resulting bias. We see that the problem is directly linked to spatial smoothing and identify exactly how the size and occurrence of bias relate to the features of the spatial model as well as the underlying confounding scenario. Using our results, we can explain subtle and counter-intuitive behaviours. Finally, we propose a general approach for dealing with spatial confounding bias in practice, applicable for any spatial model specification. When a covariate has non-spatial information, we show that a general form of the so-called spatial+ method can be used to eliminate bias. When no such information is present, the situation is more challenging but, under the assumption of unconfounded high frequencies, we develop a procedure in which multiple capped versions of spatial+ are applied to assess the bias in this case. We illustrate our approach with an application to air temperature in Germany.
#stats #statstodon #statschat #frequentist #NHST
Considering the concept of severe testing (Mayo), is there any point in planning for or running an hypothesis test if I instead determine my SESOI or predict a range of effects (e.g., 0.2<d<1.0)?
Shouldn't I just pre-register an equivalence test with those bounds, and avoid the "null hypothesis" test completely?
#statschat #statsdon #stats
Why would you multiple Cohen's d by sqrt(2) to get a "generic d"? 🤷♂️
See here:
.. the sample mean was 48.19, the expected age in the population was 50, so the difference would be 48.19 - 50 = -1.81. The standard deviation was 17.69, so Cohen's d becomes: d = -1.81 / 17.69 = 0.10. Cohen suggests to multiply this with the square root of 2, to get a generic d... (Cohen, 1988, p. 40).
#statschat #statsdon #statistics #stats
🔥 take: journals asking researchers to report p-values exactly (e.g., p = 0.032) has led to more people misinterpreting Neyman-Pearson Hypothesis Testing, and believing p-values are strength of evidence.
(instead of just reporting p < 0.05)
#statschat #statsdon #statistics #statistics
Do you know what Type M error and Type S error are?
(see Gelman & Carlin, 2014)