
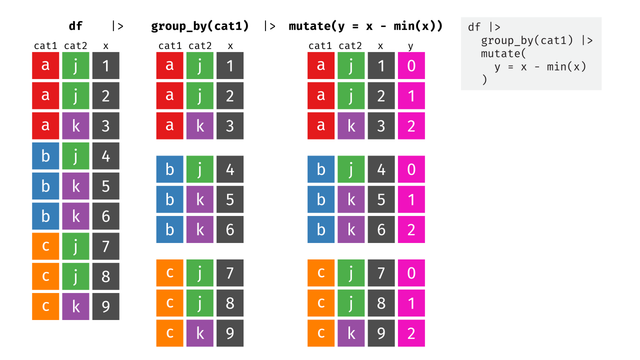
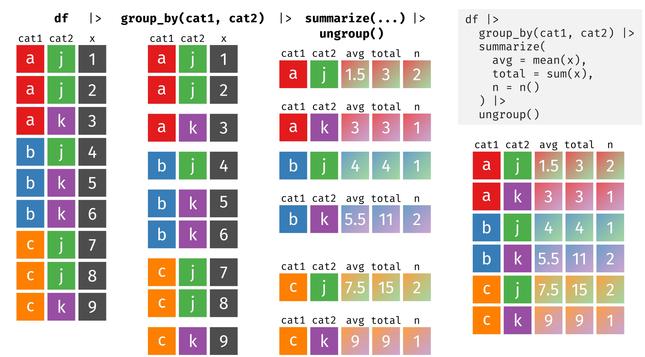
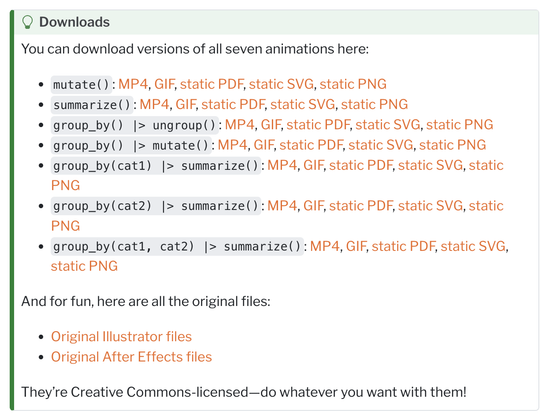
New blog post! Seven (7!) new tidyexplain-esque animations showing how {dplyr}'s mutate(), summarize(), group_by(), and ungroup() all work together #rstats #statsodon https://www.andrewheiss.com/blog/2024/04/04/group_by-summarize-ungroup-animations/

also thanks to @gaborcsardi @maelle for rhub v2, which makes it easy to configure GitHub Actions for crossplatform builds on Linux, macOS and Windows
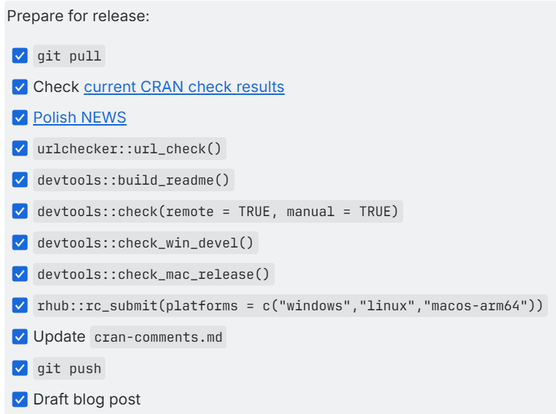
I mostly followed the 2nd edition of "R Packages" by @hadleywickham @jennybryan with a few minor tweaks to account for the differences between GitHub and Bitbucket/Jira
https://r-pkgs.org/release.html
I highly recommend this book for anyone who is writing or maintaining R code! #rstats #statsodon


Many clinical studies evaluate the benefit of a treatment based on both survival and other continuous/ordinal clinical outcomes, such as quality of life scores. In these studies, when subjects die before the follow-up assessment, the clinical outcomes become undefined and are truncated by death. Treating outcomes as “missing” or “censored” due to death can be misleading for treatment effect evaluation.
Interesting reading: Kernel Cox partially linear regression.
Building kernel Cox proportional hazards semi-parametric model and regularized garrotized kernel machine (RegGKM) method to account wide heterogeneity in cancer patients’ survival due to molecular profiles. #stats #StatisticsInMedicine #statsodon
“Split sample validation can require up to 20,000 observations to perform well enough. Otherwise the results may depend dramatically on the luck of the split. That’s why 100 repeats of 10-fold cross-validation or several hundred bootstrap resamples provide better estimates of likely model performance in most cases.”
Frank Harrel’s answer is a must-read.
https://stats.stackexchange.com/questions/627752/too-good-to-be-true-ridge-prediction


