Investigation scenario:
We just received three notifications with alerts from #Suricata #IDS

1) GPL SMTP vrfy root, from unknown IP to our mailserver

Shortly after that, two more alerts appeared:

2) ET HUNTING SUSPICIOUS Dotted Quad Host MZ Response; from the same unknown IP to Windows computer in our network
3) ET MALWARE Possible Metasploit Payload Common Construct Bind_API, again from the same unknown IP to the same Windows computer

What happened?
What to do? How to analyze network traffic and investigate those alerts?

We do not have any EDR or XDR installed on that Windows computer. Right now,we have only Suricata eve.json logs ingested to the #OpenObserve #SIEM

If you would like to see more, you are welcome to attend my @suricata webinar on March 11.
Register here: https://us02web.zoom.us/webinar/register/WN_I6BNbCU2SNG2fAOEiotPiQ

@sheogorath thanks, I can't seem to get notifs working on Android/Browser so I missed your message.

So, I ended up deploying #openobserve due to its promise of 5-in-1 ease and it works okay. BUt, the lack of Iac or CRD support for configuring it's many features is...not great.

In the empty cluster I have, it's only using like 4 gigs of ram. That's better than #elasticsearch but someone said VictoriaLogs might be better so I might look into that next.

Why do I have a feeling I'll come back to prom, loki, grafana after growing teary of such off-beat paths x)

More adventures in #selfhosting I realized that #openobserve wasn’t handling logs properly. I have a pipeline that splits out the logs to parse piefed activity pub information for metrics dashboards (other apps are pending/maybe someday). What was happening though was that everything that wasn’t in the piefed side got reduced to just the timestamp. I’m not sure why. I even tried adding a transform to copy everything over. In the end, what I did was remove the filter on right hand side entirely. This means that activity pub entries are still in the logs, but whatever.

I wound up coming here because I tried and failed to upload full sized photos to #pixelfed yesterday, but it worked today, so eh? I might have a timeout or some issue.

Attached is my new pipeline.

@mdileo I remember that I had to dial down the sample rate because #openobserve was getting OOM killed. I had left the sample rate higher when I was debugging early on. I dialed that down and did some cleanup to reduce the system usage, though I am sticking with the higher resource limits 3GB RAM mostly - it's using >2GB.

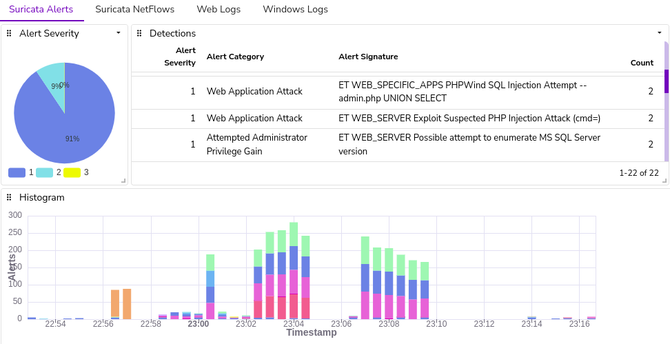
This weekend I did something very funny and disastrous in my setup of #talos #kubernetes cluster. I got up and running with my first node and various services running and saw that I was using about 5GB of RAM just for infrastructure stuff - #longhorn, #openobserve, etc. So, I decided to add another node with my #netcup provider and add VLAN, which isn't something that they advertise well.

Anyway, I purchased an identical VPS (10 arm vcpu, 16GB ram, 512GB storage), copied the machine config and patched the names, and added it to the new VPS after installing talos. It came online fine and attached to the cluster. Then I wanted to add the VLAN, so I attached that to the VMs and restarted n1(?) first - I kinda forget the order. What happened then was that I didn't quite have the right networking configuration for the vlan interface. Despite configuring dhcp: false, talos was trying to get #dhcp off of the new interface and failing, causing apid to not start, so I couldn't access the node. I was totally locked out. Eventually the same thing happened to n1, but what else had happened was that when I restarted the node to apply the vlan interface, the cluster lost quorum because, guess what? 50% is not >50%. Woops.

So, the cluster was down and I was totally locked out. With the way the interfaces work, I wound up wiping the disks and reinstalling talos on n2 until I could find the right magic.

I found a solution, but I noticed that external-dns was trying to use the internal IP and kubelet didn't know about the external id. I got around that by using explicit IP addresses for external-dns annotations for now, and also adding nodeIp: .... in the configs. Here's the final version. Notice that eth0 no longer works, I had to use enps70.

networking config

machine: network: hostname: n2 interfaces: - dhcp: true interface: enp7s0 addresses: - <my external node ip>/22 # /22 is how it's reported in netcup - dhcp: false interface: enp9s0 addresses: - 10.132.0.20/24 machine: kubelet: extraArgs: node-ip: "<my external node ip>"

#selfhosting

I been messing around trying self hosted options for logs. Mostly to scratch an itch, but also to know what is available in the market.

#openObserve is nice, but feels pretty clunky for what I want. Found this thing called #seq, which is kind of brilliant. But right now, I've settled with #victorialogs from #victoriametrics.

It can ingest #elasticsearch formatted logs. But you get the ease that #loki was trying to do. I have to say, I'm impressed. 😄

https://docs.victoriametrics.com/victorialogs/logsql/

VictoriaLogs: LogsQL

Documentation for VictoriaMetrics, VictoriaLogs, Operator, Managed VictoriaMetrics and vmanomaly

During the #SharkBytes session at #SharkFest conference I had an opportunity to present a lightning talk about my pet project called IDS Lab.
It is a lab infrastructure deployable as docker containers, which simulates the small company network.

The IDS Lab consists of web webserver with #Wordpress, #MySQL database, #Linux desktop with RDP, the #WireGuard VPN for "remote" workers and for connecting another virtual or physical machines into the lab network.
This part of infrastructure can be used for attack simulations.

There are additional components for playing with logs and detections, too: #Fluentbit, #Suricata and #OpenObserve as lightweight SIEM.

In the #SIEM we already have preconfgured dashboards for alerts, netflows, web logs and logs from windows machines, if present.

Using the provided setup script, the whole lab can be up and running in up to 5 minutes. For more info, please check my GitHub repository with the IDS Lab:

https://github.com/SecurityDungeon/ids-lab/

#sf24eu #wireshark @wireshark

GitHub - SecurityDungeon/ids-lab: IDS and detections lab infrastructure deployable as docker containers.

IDS and detections lab infrastructure deployable as docker containers. - SecurityDungeon/ids-lab

GitHub
Lol. Their docs can't decide on the port they use. #openobserve

Since morning I am searching for a nice free log analyzer, I used #splunk around 12 years just wanted to search quickly on some application logs, most probably log4j or log4net logs. I tried
- #ELK<-too hard to install configure
- #graylog<-too complex or non working docs
- #jaeger<-wanted json format
- #openobserve<-does not have simple log upload or file path provider, needs fluentd or kubectl

I did not know splunk is this good, now I am convinced it is super product. Feel free to tell if you have a good suggestion and boost please for reach.