#JamesHansen

2025 Global Temperature

Abstract. Global temperature for 2025 should decline little, if at all, from the record 2024 level.
...

https://mailchi.mp/caa/2025-global-temperature

#climate #ClimateCrisis #globalwarming #globalTemperature

500: We've Run Into An Issue | Mailchimp

World Meteorological Organization WMO: WMO report documents spiralling weather and climate impacts…

WMO’s State of the Global Climate report confirmed that 2024 was likely the first calendar year to be more than 1.5°C above the pre-industrial era, with a global mean near-surface temperature of 1.55 ± 0.13 °C above the 1850-1900 average. This is the warmest year in the 175-year observational record... #WMO #climatechange #globaltemperature

https://formuchdeliberation.wordpress.com/2025/03/24/world-meteorological-organization-wmo-wmo-report-documents-spiralling-weather-and-climate-impacts/

World Meteorological Organization WMO: WMO report documents spiralling weather and climate impacts…

WMO’s State of the Global Climate report confirmed that 2024 was likely the first calendar year to be more than 1.5°C above the pre-industrial era, with a global mean near-surface temperature of 1.…

for much deliberation
The world is on track for between 1.9 and 3.7°C of warming by 2100

While some progress has been made in limiting greenhouse gas emissions, we are still on the path for high levels of global warming

New Scientist

And now, the moment you’ve all been waiting for…

Previously on “merging global temperatures”, we looked at different ways of hierarchically grouping global temperature datasets to get a reasonable best estimate and uncertainty range. There were three principle ways to do that grouping: by SST data set, by LSAT dataset, and by INERTPolation method (the errant capitalisation will have a purposed later1).

I put these different groupings through my code for calculating an ensemble of ensembles and got the following summary statistics. I show here the annual means and a lowess smoothed series to highlight any differences in shorter and longer term behaviour.

First plot shows the means of the three ensembles and, as you can see, there is very little difference between them, so I won’t analyse this in detail.

Next up the standard deviation of the ensemble. There are some small differences here which are interesting.

The SST ensemble has a higher standard deviation in the 1880-1915 window possibly reflective of differences between marine datasets around this period. The LSAT ensemble has a larger standard deviation in the post 1930 period. Even though the differences are visible, they are still relatively small. The rule of thumb is that uncertainties in uncertainties are usually worse than 10% so we’re in that fuzzy zone where we can maybe explain why we see differences, but at the same time, we maybe don’t need to worry about them too much.

So, after all that, not much difference. This is a good thing though. It suggests that we’re not overly sensitive to reasonable choices about how to split up the ensemble.

We can also compare to what would happen if we just treated each dataset equally, as if they were all independent.

It doesn’t make much difference to the mean, but the uncertainty…

There’s a big difference there, with equal weighting generally coming in with a lower estimate of the uncertainty vs all the other combinations. This partly comes from burying DCENT in a mound of datasets that, for all their differences, are quite similar particularly in the early 20th century. I think this is a vote in favour of a more complex weighting in so far as we believe the edges of the distribution rather than mere weight of numbers.

-fin-

  • The errant spelling was wholly unintentional though. Leaving it here as a reminder. ↩︎
  • #climate #climateChange #globalTemperature

    A hierarchy of hierarchies

    Contemplating other hierarchies for merging global temperature datasets.

    Diagram Monkey

    Bear with

    It started with a trifling dissatisfaction with how the IPCC arrived at their composite global temperature series which then developed as new datasets came out. Or perhaps even before then, with a similarly trifling dissatisfaction on the very same topic. My blog doesn’t get a lot of comments, but the two more recent posts have had a lot of very interesting and technical comments from Bruce Calvert (Thanks Bruce) on how to formalise some of the ideas. My latest post on the topic largely ignored the formalisms because I have a preference for simple methods (and a small brain).

    What both are trying to do is satisfy a bunch of criteria. We have a set of different global temperature datasets, but what we want is:

  • A single dataset…
  • That integrates all of the information that the individual datasets provide
  • Also, integrating all the knowledge we have that isn’t necessarily tied up in those datasets
  • With a reasonable central estimate
  • And an uncertainty range that represents our uncertainty
  • which can be used to generate samples that are representative of uncertainty at all time scales
  • and are representative of actual global temperature variability
  • These criteria would make a useful dataset with broad utility.

    My method (as it has developed) provides 1, 4, 5, and 6, but falls short on 2, 3 and 7 by throwing out some information and mixing together datasets that represent somewhat different things. One could quibble about 4, 5, and 6 of course.

    The Guttorp and Craigmile method (see also) provides 1, 4, 6, and 7, but does less well (in my assessment, see the links above) on 2, 3 and 5. In places their central estimate is likely compromised by poor dataset choices and they ignore information that is available in the datasets. These issues could be remedied.

    Is it reasonable? Well, it includes some older datasets (e.g. GETQUOCS) that have old bias adjustments because they have a nice uncertainty analysis. One might even argue that with the publication of DCENT, all other datasets are questionable. I would counter that by noting that the major compelling improvements from DCENT really affect the early 20th century warming, but prior to that it just widens the uncertainty range.

    Does it really represent our uncertainty? Again, it’s hard to say. We have an ensemble of opportunity and rather a poor one at that. The hierarchical grouping I suggested is healthier than it was when I first suggested it. We now have DCENT and COBE-STEMP3, which broaden the range of estimates, but we are still trying to estimate a broad distribution with a handful of samples. My method is only as broad as the range of the datasets we have but this is partly by design. Another thing missing is the fact that we know that mixing and matching the land and ocean components of NOAAGlobalTemp and HadCRUT would widen the spread.

    Does it use all the information? No. The hierarchy tries to encode the major covariances that define the structural uncertainties, assuming these come from the choice of SST (or marine temperature) dataset. We know that datasets use similar land temperature datasets and largely the same sea ice datasets. I also don’t use uncertainty ranges if they’re not represented by an ensemble. This is partly in order to avoid having to make assumptions about the correlation structures of the errors and partly because I don’t know what those structures are. I’m also missing information from the NOAAGlobalTemp ensemble. That would be a very useful addition. The Vaccaro dataset also has an ensemble and an interestingly different interpolation approach. And now there is a new dataset in preprint, GloSAT, which combines marine air temperatures with land air temperatures to give a completely new beast.

    How to do better?

    One obvious way is to get those missing ensembles.

    Another is to employ the more formal statistical approach

    Sticking with my simplistic approach, Bruce came up with an interestingly objective way to weight datasets using the estimated covariances between them. This would rely on expert judgement and it seems like this would be a difficult issue. There’s not a single covariance between datasets. Say two datasets use the same SST dataset, but different interpolation methods and land temperatures. At any time step, the two datasets will effectively give the SST dataset different weights and those weights will change over time. That means the covariance will change over time too. The temporal structure will also vary with time. It’s complex but we could come up with reasonable approximations. We could weight land and ocean as 30:70 representing the ratio, or have some simple smoothed representation. We could develop a hierarchy of hierarchies. We could take a survey of experts, asking them to make their covariance estimates. etc.

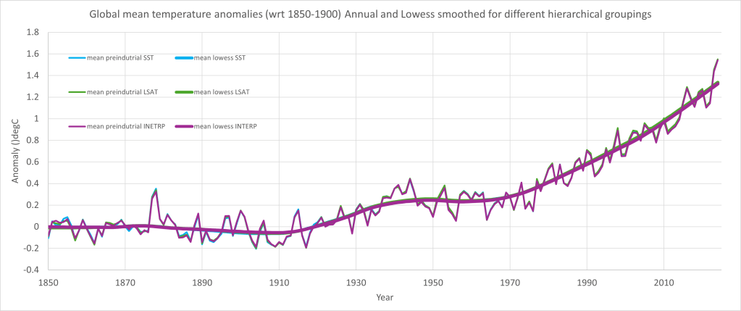
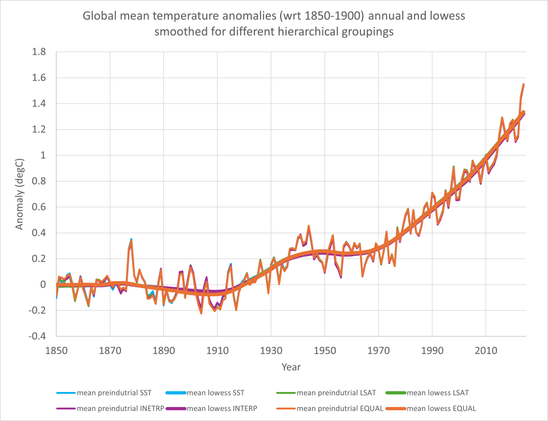
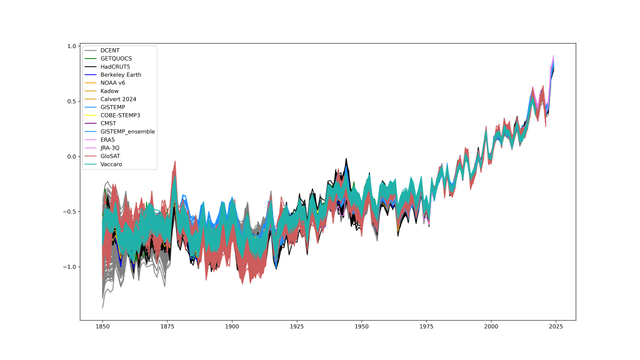
    So, a first minimal extension is to include GloSAT and Vaccaro ensembles, because the data are just there begging to be used. I rearranged the hierarchy to put Vaccaro and GETQUOCS in the same category and separated them from the HadCRUT5 datasets. I also jacked the ensemble up to 50,000 members because I can and I want to make matplotlib explode.

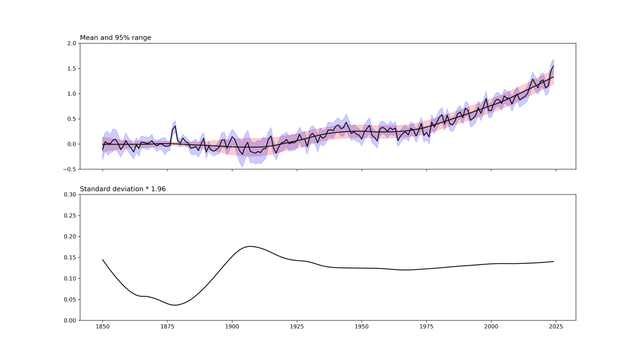
    The shape of the uncertainty curve might look odd, but it’s just a consequence of using 1850-1900 as a baseline. Uncertainty is generally smaller during the baseline period because each ensemble member is forced to average to zero during that period. It increases afterwards because there is a lot of uncertainty in the early 20th century.

    Till next time…

    #climate #climateChange #globalTemperature #python

    One global temperature dataset to rule them all and in the darkness bind them

    Is there a better way to combine global temperature datasets?

    Diagram Monkey

    OilPrice.com: Will 2025 Be a Turning Point for Climate Policy…

    Eight in ten people agree that the average #globaltemperature will increase in 2025... #climatechange #globalwarming #climatepolicy

    https://formuchdeliberation.wordpress.com/2025/01/09/oilprice-com-will-2025-be-a-turning-point-for-climate-policy-2/

    OilPrice.com: Will 2025 Be a Turning Point for Climate Policy…

    Eight in ten people agree that the average #globaltemperature will increase in 2025… #climatechange #globalwarming #climatepolicy

    for much deliberation
    Researchers point out that the rapid increase in global temperature might be due to reduced planetary albedo.
    https://newstainmentora.blogspot.com/2024/12/researchers-point-out-that-rapid.html
    #GlobalWarming #globaltemperature #Earth #planet #newstainmentora
    Researchers point out that the rapid increase in global temperature might be due to reduced planetary albedo.

      Researchers at the Alfred Wegener Institute (AWI) have identified a major loss in the Earth's planetary albedo as a potential reason o...

    NewsTainmentOra

    Sunday Monday and Tuesday this week all exceeded Global Daily Average Temperature Record set in July 2023. Welcome to the Anthropocene.

    “Monday 22 July revised to 17.16C, as Tuesday comes in at 17.15C. Both break the Sunday global temperature record and all break the global temperature record set last year
    17.15C 23 July 2024
    17.16C 22 July 2024
    17.09C 21 July 2024
    17.08C 6 July 2023 “ - 🇦🇺climatologist Andrew Watkins
    #GlobalTemperature #climatecrisis
    https://pulse.climate.copernicus.eu/

    Heat wave causes havoc in Mali, kills 100 people - African Percentions

    Mali is among the countries currently suffering extreme heat with some areas hit by a temperature of 48,5°C, has recorded more than 100 deaths, victims of the heat wave. Malian meteorologists say the city Southwestern di Kayes recorded the hottest day in African history on April 4, 2024.... #mali #bamako #heatwave #globaltemperature #climatecrisis #climatecatastrophe #westafrica #africa #worldnews #ecowas #weather #meteorology #worldwithoutus

    https://africanperceptions.org/en/2024/04/heat-wave-causes-havoc-in-mali-kills-100-people/

    Heat wave causes havoc in Mali, kills 100 people - African Percentions

    Mali is among the countries currently suffering extreme heat with some areas hit by a temperature of 48,5°C, has recorded more than 100 deaths, victims of the heat wave. Malian meteorologists say the city Southwestern di Kayes recorded the hottest day in African history on April 4, 2024. The country, which just recovered from series […]

    African Percentions
    We need to be on the same page determining this for informed policy decisions: Approaching 1.5 °C: how will we know we’ve reached this crucial warming mark? #ClimateCrisis #globalwarming #globaltemperature #tippingpoints #emissions #netzero https://www.nature.com/articles/d41586-023-03775-z
    Approaching 1.5 °C: how will we know we’ve reached this crucial warming mark?

    Assessing global mean temperature rise using the average warming over the previous one or two decades will delay formal recognition of when Earth breaches the Paris agreement’s 1.5 °C guard rail. Here is what’s needed to avoid the wait.