So the UofA allows first year law students to act as lawyers for the Student Legal Services (SLS). Most schools require at least 3rd year students. Unbelievable.
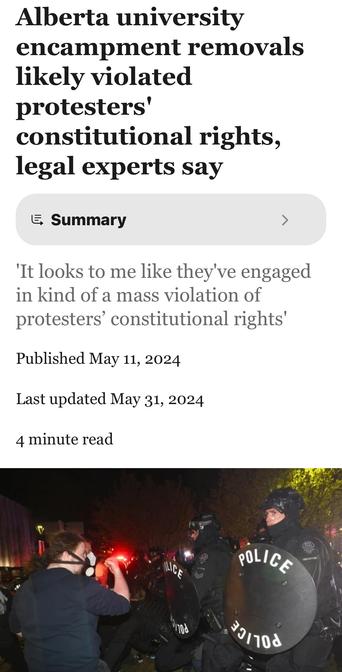
It would be most appropriate for my Alma Mater to offer a course on Palestine that includes the violence my Alma Mater waged against peaceful anti-genocide protestors.
My Alma Mater (and the UofC) should also be required to take a class on 1930's Germany and on what the terms nazi sympathizer and quisling mean.
#UofA #UniversityOfAlberta #AbPoli #UofC #YEG #YYC #AbPoli #GenocideSympathizers
My alma mater, the University of Alberta, supports genocide. That action is contrary to the lessons I learned at the UofA:
"Our report to the UN sets out the UofA’s disclosed investments across four fiscal years (2020-21, 2021-22, 2022-23, and 2023-24) and includes detailed information about 25 of the companies UofA has invested in that are known to be violating Palestinians’ rights"
I would not want to be in leadership of any public university, as they’ve been under attack from the Republican regime for many years, though the attacks are certainly ramping up.
But if I was, I’d fucking walk before I caved in and abandoned my principles to appease a fucking lunatic and his sycophants.
I’m disappointed in you, University of Arizona.
It's time to KICK/OFF the new Arizona Football season with DUSK and the U of A! 🐻⬇️
#BearDown with us on April 19th for a FREE, family-friendly celebration in Arizona Stadium at the 2025 Spring Showcase
🏈 Field goal kicking contest at halftime for 10 lucky fans!
🐤 "Egg" hunt in-stadium with incredible prizes!
🎶 Live music + DJ's and DUSK-related fun!
🎡 Kids zone with games, activities & giveaways!
🍔 Food and
🍻 Drinks!
🌵 The Pride of Arizona + Spirit Squad + Wilbur & Wilma!
🍿 Post-game movie Cars on the football field!
📅April 19th, 2025 @ 5pm
🏟️Arizona Football Spring Showcase
📍Arizona Stadium
🎟️Free entry
#DUSKPresents #UofA #KICKOFF #ArizonaFootball #SpringGame #DuskMusicFestival
Congratulations to Matthew on graduating form the UofA School of Engineering! We had a fun grad session on campus last weekend.
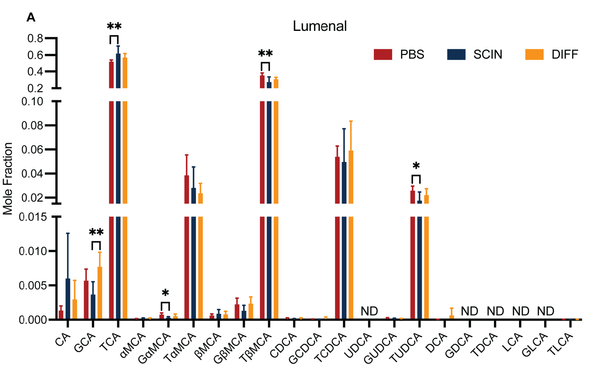
Supplemental Figure S1 for "Clostridium scindens exacerbates experimental necrotizing enterocolitis via upregulation of the apical sodium dependent bile acid transporter"
Supplemental Figure S1. Lumenal and intracellular levels of individual bile acid species. Bile acid quantities were determined by mass spectrometry. Values are expressed as mean mole fractions of the lumenal or intracellular bile acid pool ± standard deviation. Significance differences were determined by one-way ANOVA followed by Holm-Šídák multiple comparisons test (*P
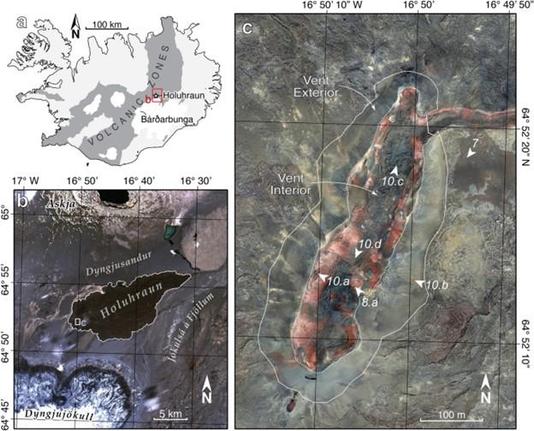
Repeat surveys of the topography of the main vent of the 2014–2015 eruption at Holuhraun, Iceland: Merged LiDAR and UAS point clouds from 2015, 2016, 2018, and 2019
Dataset Format:3D point clouds in LAS (.las) format.Abstract:Repeat surveys with both a tripod-mounted terrestrial laser scanning (TLS) and an unoccupied aircraft system (UAS) were conducted of the main vent (informally named Baugur) of the 2014-2015 Holuhraun volcanic eruption in northern Iceland (64.87° N, 16.84° W) to generate a high-resolution topographic time series. The TLS and UAS datasets were merged to get complete horizontal spatial coverage and to fill gaps in the TLS coverage due to obscuration from the ground-based perspective within the vent. Merged datasets were registered to the 2015 TLS point cloud in a relative sense. Merged 3D topographic models of Baugur from 2015, 2016, 2018, and 2019 were then compared to quantify the topographic change from year to year (Sutton et al. 2024).Purpose:These data were acquired to create a time series for topographic change detection analysis of the degradation of a spatter rampart within the first years immediately following the cessation of eruptive activity.Credits/Funding Sources:Research was conducted with permission from Vatnajökull National Park Service (Vatnajökulsþjóðgarður).Data Status and Update Plans:This data set is completeTime period represented in the dataset (YYYYMMDD):20150821–2015082620160728–2016080320180802–2018080920190729–20190801Data Quality:Attribute Accuracy:Horizontal units for each point in the dataset are in meters.Vertical units are meters, with scaling = 1.0.TLS point spacing, maximum 2 cm voxels (using the octree method to filter the original point clouds).UAS-derived DEMs: 20 cm grid (2016 and 2018), or 12 cm grid (2019) resulting in 3D point clouds of similar spacing.Merged data point cloud spatial resolution is a combination of the TLS and UAS point densities (Fig. S1).Logical Consistency:Quality checks were performed to verify that the merged data were consistent, and that year-to-year relative registration processes minimized differences in non-changing terrain.Completeness:Dataset is considered complete for the information presented, as described in the abstract. Users are advised to read the rest of the metadata record carefully for additional details.Positional Accuracy:The largest contributor to TLS position precision is uncertainty in the differential global positioning system (dGPS), which, according to the manufacturer, has an experimentally measured vertical uncertainty of 2 cm and horizontal uncertainty of 1 cm. Positional adjustments during the relative registration of the merged datasets were likely larger than the TLS absolute position knowledge. Horizontal coordinates should be considered relatively accurate.SpatialNW corner: 64.8738° N, -16.8401° ESE Corner: 64.8678° N, -16 .8267° ECoordinate system:UTM Zone 28N, WGS 84 datumProcessing Steps:TLS surveys were generated from individual light detection and ranging (LiDAR) scans using a tripod-mounted Riegl VZ-400 laser scanner with a horizontal range of 400 m geolocated using a Trimble R8 Global Navigation Satellite System (GNSS) base station and a matching R8 rover mounted on top of the Riegl scanner (see Whelley et al. 2023, for details). Each year's survey scans were combined into a single point cloud, filtered from the native point density to 2-cm spacing, exported in LAS format, and georeferenced to the UTM Zone 28N (WGS 84 datum) coordinate system using the Point Data Abstraction Library (PDAL Contributors, 2020). TLS point clouds of Baugur and vicinity were cropped to define the same coverage common to all years' surveys.To expand photographic and topographic coverage of Baugur and provide independent topographic data of the study area, the fissure vent and surrounding region were surveyed in 2016, 2018, and 2019, with a Trimble UX5-HP fixed-wing UAS (Cosyn and Miller, 2013). A Sony α7R digital camera with a 15 mm lens acquired images at 1–4 cm/pixel from 90–120 m above ground level. Images were precisely georeferenced with post-processed dGPS data collected from the on-board GPS unit, inertial measurement unit (IMU), and base station receiver (Trimble R10). The aerial images, acquired at a nominal pixel scale of 4 cm, were bundle adjusted in the Trimble Business Center photogrammetry module to generate a 12 and 20 cm/pixel digital elevation model (DEM) and 4 cm orthoimage mosaics covering the vent region.Both topographic datasets were combined into a merged point cloud for each year where both TLS and UAS data were collected (2016, 2018, 2019). Topographic dataset merging was performed in CloudCompare v2.11 (CloudCompare, 2021), a free and open source point cloud processing software. For each year, the TLS point cloud and the gridded UAS DEMs were imported into CloudCompare. The cloud-to-cloud (C2C) comparison tool within CloudCompare was used to perform a rigid transformation of the UAS data to align it to the TLS point cloud for a given year. An initial run of C2C provided preliminary information about areas where actual topographic changes had likely occurred. Subregions of the TLS and UAS point clouds were compared in the C2C measurement, effectively masking out areas where real topographic changes had occurred. The transformation matrix resulting from comparing the areas that experienced the least changes was then applied to the entire UAS point cloud to bring it into alignment with the TLS point cloud. The UAS and TLS point clouds were then merged by adding topographic vertices from the aligned UAS point cloud to the TLS point clouds if no TLS vertices were within 10 cm (i.e., half of the UAS gridded dataset spatial resolution). This addition preserved all TLS vertices, extended coverage beyond the TLS surveys, and filled in data gaps with the aligned UAS points.Final TLS-UAS merged point clouds were given minor rotation and translation adjustments to geographically co-register all point clouds and enable analysis of year-over-year topographic changes within the study area. The merged point cloud for 2016 was registered to the 2015 TLS point cloud by comparing the TLS-only coverage in both years. As the extent of the UAS coverage is much greater, later point clouds required minor shifts to achieve a relative adjustment for 2018 and 2019 to match the 2016 merged data.The error in registering each pair of merged point clouds was determined by performing a statistical analysis of areas where year-to-year changes were assumed to be minimal. These areas are primarily covered only by UAS data in the relatively flat surfaces beyond the vent edifice. Additionally, small areas of the vent floor that showed minimal elevation differences were extracted to include areas with LiDAR-only coverage in the analysis.Point clouds were exported from CloudCompare to LAS (.las) format with a precision of 0.01. The point data contains x, y, and elevation in meters.References:CloudCompare version 2.11.3 (2021) GPL software. Retrieved from http://www.cloudcompare.org/. Accessed 3 September 2023Cosyn P, Miller R (2013) Trimble UX5 Aerial Imaging Solution–A New Standard in Accuracy, Robustness and Performance for Photogrammetric Aerial Mapping. White Paper. Available online at https://www.semanticscholar.org/paper/Trimble-UX5-Aerial-Imaging-Solution-Cosyn-Miller/2bd7fad8fb7107eb4e0192d0c95726ad3b639ac5. Accessed 3 September 2023PDAL Contributors (2018) PDAL Point Data Abstraction Library. https://doi.org/10.5281/zenodo.2556738Sutton SS, Richardson JA, Whelley PL, Scheidt SP, Hamilton CW (2024) Degradation of the 2014–2015 Holuhraun vent-proximal edifice in Iceland. Bulletin of Volcanology. https://doi.org/10.1007/s00445-024-01709-9Whelley PL, Sutton S., Richardson JA, et al. (2023) NASA GIFT Iceland Highlands: 2015-2019 Baugur LiDAR. U.S. Geological Survey data release. https://doi.org/10.5066/P9VQPE9WFor inquiries regarding the contents of this dataset, please contact the Corresponding Author listed in the README.txt file. Administrative inquiries (e.g., removal requests, trouble downloading, etc.) can be directed to data-management@arizona.eduThis item is part of the Holuhraun, Iceland collection.
"@redata provided a user-friendly, long-term solution for archiving the data and code produced through my PhD research at the University of Arizona. Not only has @redata given me an #openaccess option for licensing, storing, and citing these datasets, but the thorough review conducted by the repository specialists has ensured that these archives are accessible and properly documented for any potential future users." - Tyler Meng, Graduate Research Associate
