I’m giving a talk at R-Ladies Abuja next week 💜 💙

We’ll dive into #ggplot2 tricks from our "ggplot2 uncharted" class — focusing on both #dataviz best practices and advanced #coding 💪

Sign up for the free session here:
https://www.meetup.com/rladies-abuja/events/313505524/

#datavis #rstats #tidyverse #datascience

🎥 New recording available!

What’s new in {dplyr} 1.2.0?
In this R-Ladies Rome session, Isabella Velásquez shows when to use the new features and how they improve real data workflows.

Watch the talk 👇
https://rladiesrome.org/talks/2026/meetup/03182026_isabellavelasquez.html

#RLadiesRome #rstats #DataScience #Tidyverse #WomenInTech

✨ Introduction to tidymodels

🗓 March 27, 2026 | ⏰ 9:30–11:00 AM (PHT)
🎤 Emil Hvitfeldt | 💻 Zoom (link after RSVP)

🔗 Register: https://www.meetup.com/r-nvsu/events/313596851/

#RStats #tidyverse #tidymodels #datascience

Introduction to tidymodels, Fri, Mar 27, 2026, 9:30 AM | Meetup

Learn how to build machine learning and statistical models in R using [tidymodels](https://www.tidymodels.org). Tidymodels is a a collection of packages designed for modeli

Meetup

✨ Tidyplots for easy data visualization

🗓 March 25, 2026 | ⏰ 7:00–8:30 PM (PHT)
🎤 Dr. Jan Broder Engler | 💻 Zoom (link after RSVP)

🔗 Register: https://www.meetup.com/r-nvsu/events/313337627/

#RStats #tidyverse #tidyplots #dataviz #datascience

Tidyplots for easy data visualization, Wed, Mar 25, 2026, 7:00 PM | Meetup

Data visualization is a crucial tool for understanding and communicating experimental findings, yet complex plotting syntax often creates a steep barrier for beginners and

Meetup

✨ Introduction to tidyverse

🗓 March 24, 2026 | ⏰ 9:30–11:00 AM (PHT)
🎤 Dr. Kelly N. Bodwin | 💻 Zoom (link after RSVP)

🔗 Register: https://www.meetup.com/r-nvsu/events/313596811/

#RStats #tidyverse #DataScience

Introduction to tidyverse, Tue, Mar 24, 2026, 9:30 AM | Meetup

Learn about how to wrangle data with the [tidyverse](https://tidyverse.org) package.

Meetup

I'm going to need Hadley Wickham to make up his mind.

  • early 00s - 2020s: recoding with dplyr is annoying; just use car::recode()
  • 2020s: dplyr::recode() happens, breaking bazillions of scripts, functions, and analyses
  • 2024: dplyr::recode() is deprecated; use case_match or case_when instead; it's way better except that you I have no idea why it was better, I just had to learn a new syntax form. I think many people just went back to car::recode(), at this point
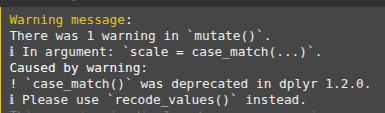
  • 2026: Now apparently case_match() is deprecated, and we're supposed to use a new function: recode_values(). I'll go learn about it when I have time.

Can we please just let this one stick around a few years? This isn't some esoteric, rare function; this is every day. All the time. Every time this breaks, it costs me hours of my life and comes back to cost me more hours in future years. as older, now-broken code refuses to work when I want to use it, and I spend an hour debugging before I remember.

Edit: I actually think Hadley Wickham is phenomenal and has probably (in my limited view) done more for R than any other1 single person in the past 20 years. I also know that something like tidyverse must evolve. My occasional gripes about the cycle of new functions, and my frequent frustration at just not understanding things quickly enough, are very small compared to my gratitude that the tidyverse is what it is.

1 Sorry, Yves Rosseel2 ... I'm a huge fan, but it's just a numbers game, you know? Laaan is my favorite package!

2 Huh. Spell check in Vivaldi helped me spell Rosseel correctly.

#rstats #complaints #deprecated #tidyverse

💪 The mighty R library, ggmap, helps you visualize data geospatially.

👇 We teach you how to make great looking data with Stadia Maps.

https://docs.stadiamaps.com/tutorials/getting-started-in-r-with-ggmap/?utm_campaign=tutorial_start_ggmap&utm_source=mastodon&utm_medium=social

#RStats #DataViz #Geospatial #Tidyverse

Quickstart: ggmap - Stadia Maps Documentation

Learn how to use Stadia Maps basemap tiles in R with ggmap.

If you regularly create visualizations in R, the tidyplots package is worth exploring.

The figure below shows examples from the tidyplots website: https://tidyplots.org/

I recently released a new Statistics Globe Hub module about tidyplots: https://statisticsglobe.com/hub

#rstats #datascience #tidyverse